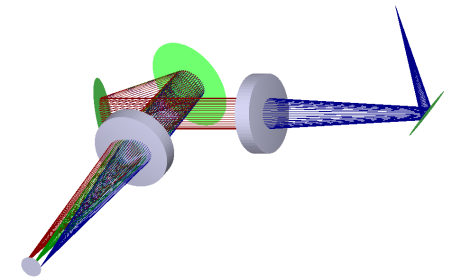

The optical layout of LISA spectrograph
(LISA = Long slit Intermediate resolution Spectrograph for Astronomy).
For the present test, the entrance reflective slit is replaced by a fiber optic interface.
For more details about LISA, click here.
LISA spectrograph
Fiber
optical link version


The
optical layout of LISA spectrograph
(LISA = Long slit Intermediate resolution
Spectrograph for Astronomy).
For the present test, the entrance reflective
slit is replaced by a fiber optic interface.
For more details about LISA,
click here.
|
|
|
|
|
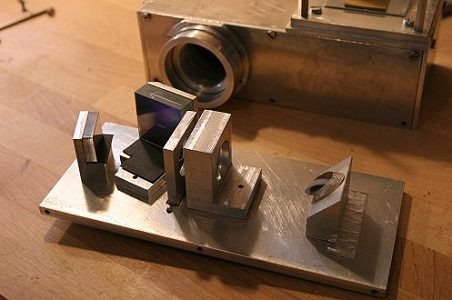
The telescope interface (a 0.2m Takahashi CN-212 reflector). A thin film 8/92 beam splitter is used for direct a fraction of the stellar flux (8%) toward a video camera Watec 120N. The interface is also developped for an Echelle spectrograph project. |
The arrival of the 50 microns optical fiber (10-meters long). The configuration tested of LISA spectrograph use a 600 grooves/mm grating for an effective resolution power of R = 1000. |
The camera lens is a moderate cost, but high quality, Canon 85 mm f/1.8 model. The CCD camera is an Audine with a Kodak KAF-1602ME (1520x1024, 9 microns pixel). The mean inverse spectral dispersion is 1.7 A/pixel (190 A/mm). |
Lamp sources for spectral calibration

2D
Neon spectrum
(simple security lamp). Bleu is left, red is right.

2D
Xenon spectrum
(Pen Ray lamp).

Mercury vapor
spectrum (Pen Ray lamp).

The composite
LISA spectrum used for a precise spectral calibration. It is the superposition of a xenon lamp
spectrum plus a neon lamp spectrum.
Typical 2D aspect of stellar spectra
(the size is reduced by a
factor 0.75 relative to the
original image)


Form up to
down, spectra of Vega, Beta Lyr, P Cyg and SS Vir.
Some spectra of artificial sources
Observed signal
(instrumental response not corrected)
|
|
|
|
|
|
|
|
|
|
|
|
Note (1): The standard bleu LED has two spectral components (bleu emission
from a GaAIN semiconductor, yellow emission from cerium activated yttrium).
Note
(2): a LCD computer is a possible alternative for spectral calibration
(presence of mercury element) !
Note (3): a xenon low pressure thermoionic
discharge lamp (here a Pen-Ray model) is well complementary to neon lamp for
precise spectral calibration.
Some stellar spectra observed during
first ligh period of the fiber version of LISA (April 24 to April 27, 2008)
(spectral
and radiometric calibration are applied)
|
|
|
|
|
|
|
|
|
|
|
|
|
|
|
|
|
|
|
|
|
|
|
|
|
|
|
|
|
|
|
|
|
Note 1: for a complete observation
report of nova Cyg 2008 #2, click here.
Note
2: for a complete observation report of nova Sgr 2008, click
here.
Industrial control applications
For example, because the
fiber link, the spectral transmission measure of optical filter is a relatively
simple process.
Here,
the transmission curve verification of an Astronomik CLS filter
(and comparison
with a measured typical sodium pollution light distribution)
