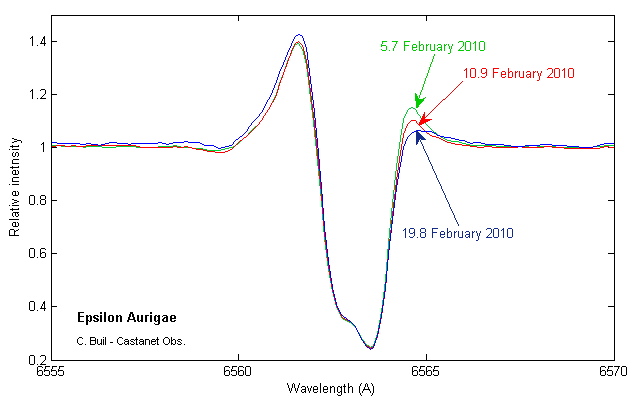
Example of fast Ha evolution.
Bright stars spectrographic observation series
Epsilon Aurigae
RA: 5H02.0M - DEC: +43°49' (2000,0)
Latest
update: October 7, 2010
See also Epsilon Aurigea campaign (Jeff Hopkins)
See also general compaign compilation spectra (Robin Leadbeater)
Instrument: 0.28 m telescope (Celestron
11) + eShel spectrograph (R=11000) + QSI532 CCD camera (CCD KAF3200ME)
Observatory:
Castanet-Tolosan (France)
Observer: Christian Buil
Processing: Standard échelle
pipeline (Reshel software V1.11). H2O telluric lines removed (division by
a synthetic H2O spectrum at the same spectral resolution of the acquired data
- the telluric lines list is
from GEISA database (LMD/CNRS)). Also, the diurnal and annual earth velocity
are corrected - the precision is better 1 km/s. Date are given in UT.
Journal of the observations
(click
on the data names for download)
|
# |
JD |
FITS format |
DAT format |
|
1 |
2455033.652 |
||
|
2 |
2455082.534 |
||
|
3 |
2455101.617 |
||
|
4 |
2455108.656 |
||
|
5 |
2455122.605 |
||
|
6 |
2455134.467 |
||
|
7 |
2455148.429 |
||
|
8 |
2455152.342 |
||
|
9 |
2455156.357 |
||
|
10 |
2455158.314 |
||
|
11 |
2455160.369 |
||
|
12 |
2455175.301 |
||
|
13 |
2455183.533 |
||
|
14 |
2455186.325 |
||
|
15 |
2455207.240 |
||
|
16 |
2455208.380 |
||
|
17 |
2455212.244 |
||
|
18 |
2455215.344 |
||
|
19 |
2455219.242 |
||
|
20 |
2455224.240 |
||
|
21 |
2455228.293 |
||
|
22 |
2455230.259 |
||
|
23 |
2455233.258 |
||
|
24 |
2455238.333 |
||
|
25 |
2455247.266 |
||
|
26 |
2455251.325 |
||
|
27 |
2455254.272 |
||
|
28 |
2455257.268 |
||
|
29 |
2455266.277 |
||
|
30 |
2455269.277 |
||
|
31 |
2455271.282 |
||
|
32 |
2455273.277 |
||
|
33 |
2455434.563 |
||
|
34 |
2455439.574 |
||
|
35 |
2455441.545 |
||
|
36 |
2455442.556 |
||
|
37 |
2455443.557 |
||
|
38 |
2455444.595 |
||
|
39 |
2455450.541 |
||
|
40 |
2455453.486 |
||
|
41 |
2455454.494 |
||
|
42 |
2455459.487 |
||
|
43 |
2455460.505 |
||
|
44 |
2455465.488 |
||
|
45 |
2455466.566 |
||
|
46 |
2455468.454 |
||
|
47 |
2455469.449 |
||
|
48 |
2455484.386 |
||
|
49 |
2455485.476 |
||
|
50 |
2455488.421 |
||
|
51 |
2455490.502 |
||
|
52 |
2455491.426 |
||
|
53 |
2455495.489 |
||
|
54 |
2455496.455 |
||
|
55 |
2455498.404 |
||
|
56 |
2455515.636 |
||
|
57 |
2455517.325 |
||
|
58 |
2455519.578 |
||
|
59 |
2455520.510 |
||
|
60 |
2455524.289 |
||
|
61 |
2455525.300 |
||
|
62 |
2455527.297 |
||
|
63 |
2455531.507 |
||
|
64 |
2455535.286 |
||
|
65 |
2455543.394 |
||
|
66 |
2455544.259 |
||
|
67 |
2455545.239 |
||
|
68 |
2455549.224 |
||
|
69 |
2455550.224 |
||
|
70 |
2455551.266 |
||
|
71 |
2455556.356 |
||
|
72 |
2455571.296 |
||
|
73 |
2455575.289 |
||
|
74 |
2455576.249 |
||
|
75 |
2455577.230 |
||
|
76 |
2455579.317 |
||
|
77 |
2455581.410 |
||
|
78 |
2455582.317 |
||
|
79 |
2455583.274 |
||
|
80 |
2455585.282 |
||
|
81 |
2455586.247 |
||
|
82 |
2455587.279 |
||
|
83 |
2455597.284 |
||
|
84 |
2455598.244 |
||
|
85 |
2455599.249 |
||
|
86 |
2455601.264 |
||
|
87 |
2455603.266 |
||
|
88 |
2455604.366 |
||
|
89 |
2455611.256 |
||
|
90 |
2455613.336 |
||
|
91 |
2455614.279 |
||
|
92 |
2455801.622 |
||
|
93 |
2455813.508 |
||
|
94 |
2455817.539 |
||
|
95 |
2455830.497 |
||
|
96 |
2455840.479 |

Example
of fast Ha
evolution.
|
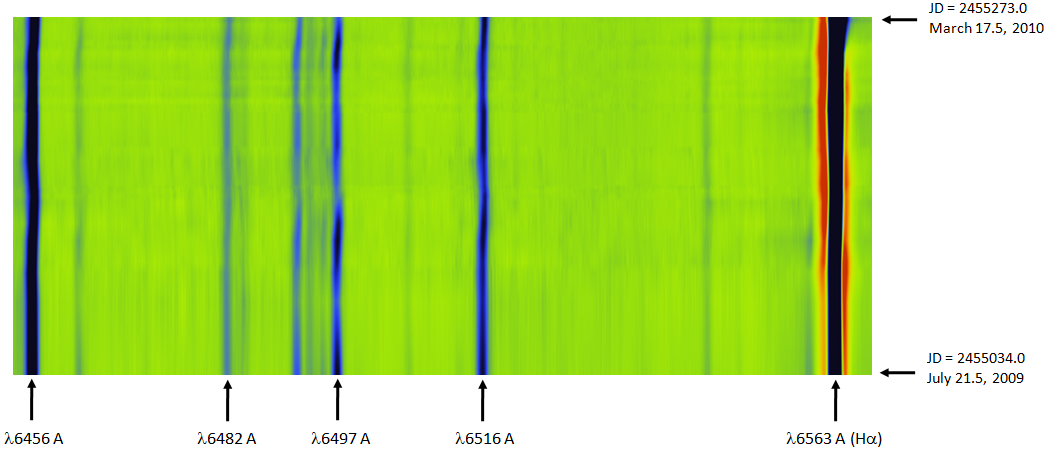
Dynamic time evolution spectrum
near Ha line
observed from July 21.5, 2009 to March10.5, 2010. Note Ha V/R
ratio evolution and shape changes on the 6497 A line. |
|
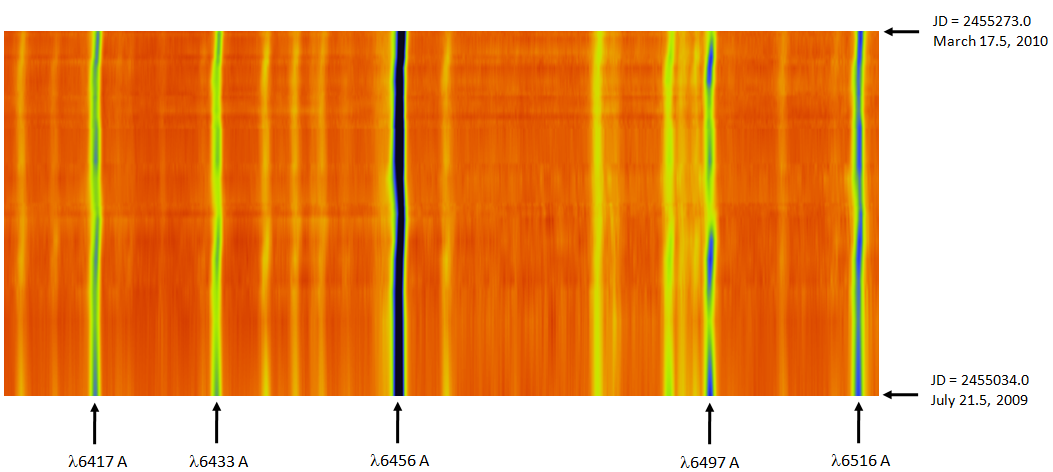
High contrast visualisation of the time series spectra centered on 6456 A line (false-colors display). |
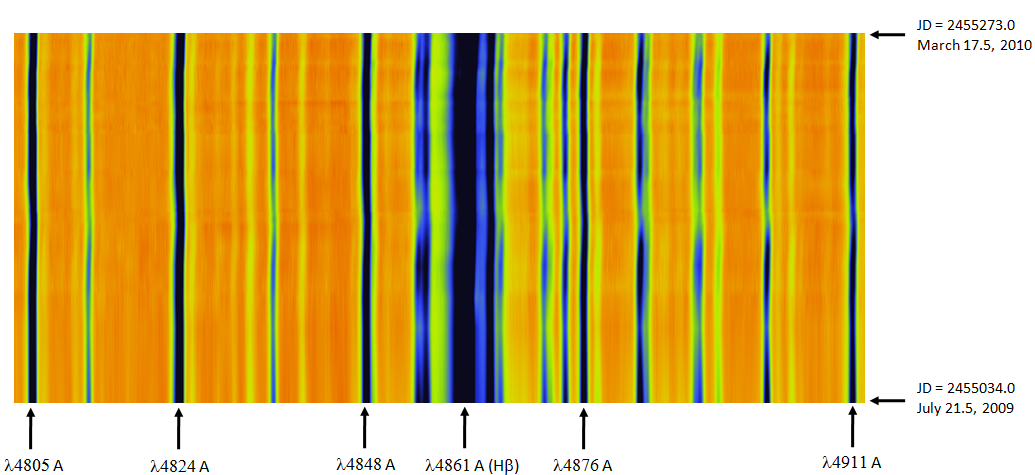
| High contrast visualisation of the time series spectra centered on Hb line (false-colors display). |

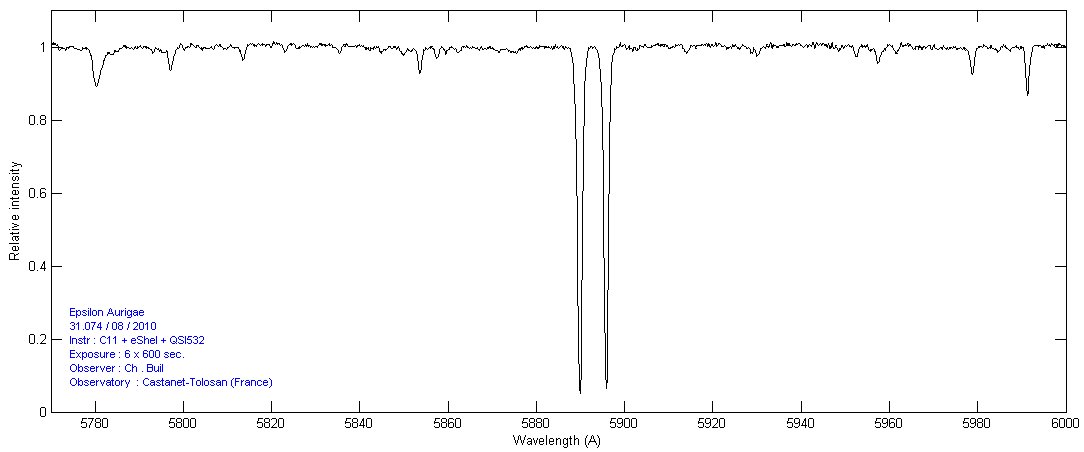
| Time series spectra centered on D1-D2 sodium lines (false-colors display). |
|
|
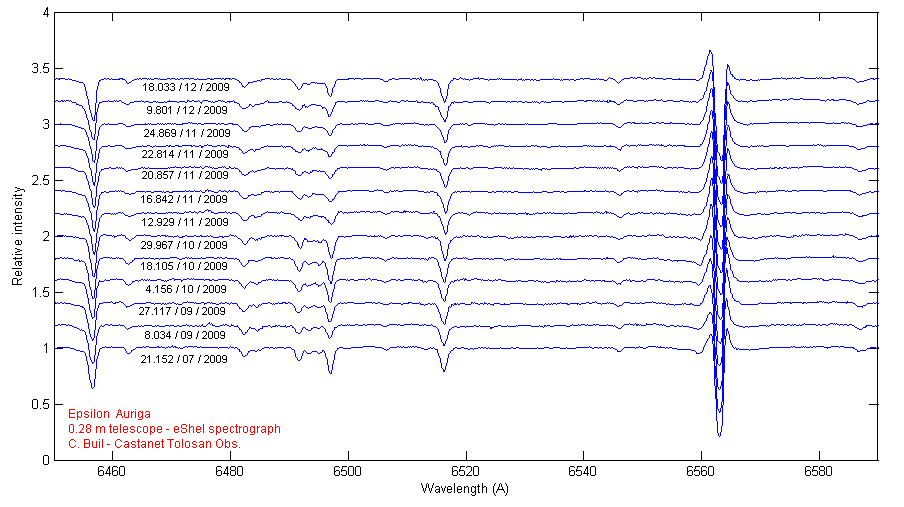
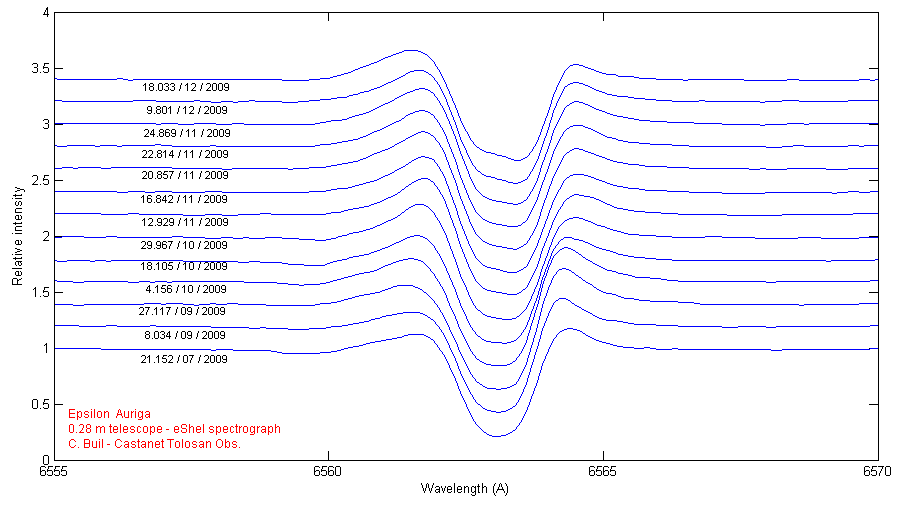
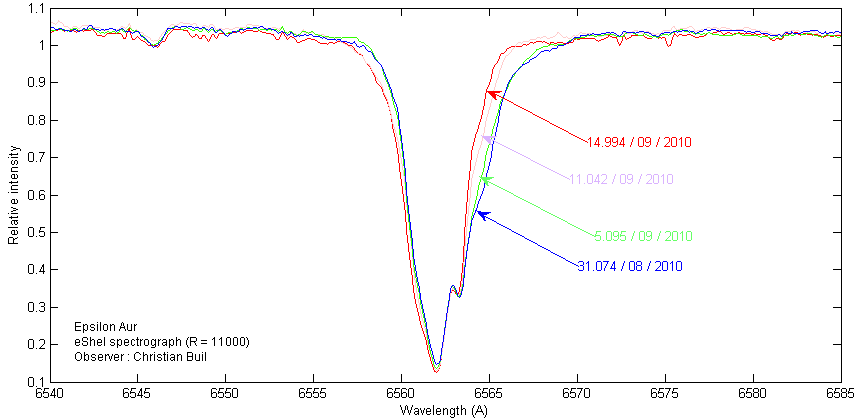
Line
profile variability near Ha
. The spectra are offset from botton to top according to their acquisition times.
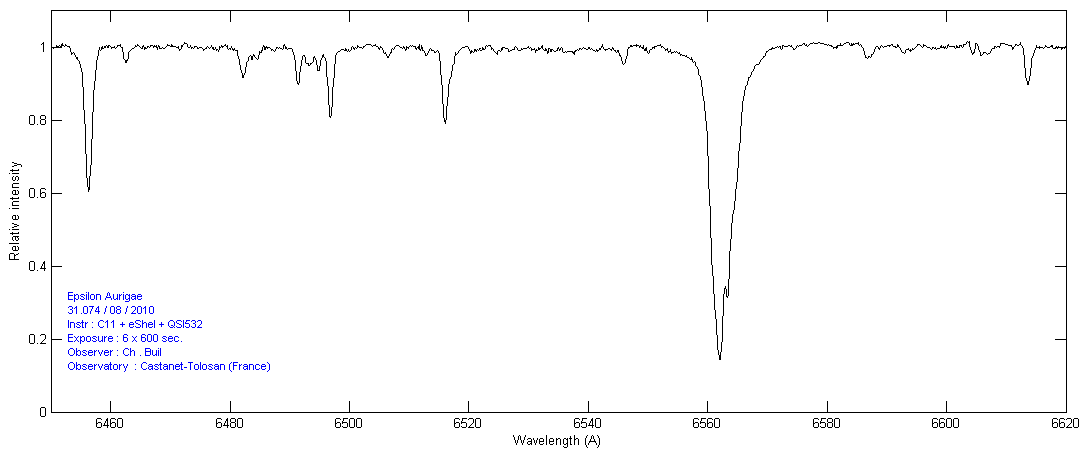
Detail
of Ha
line activity
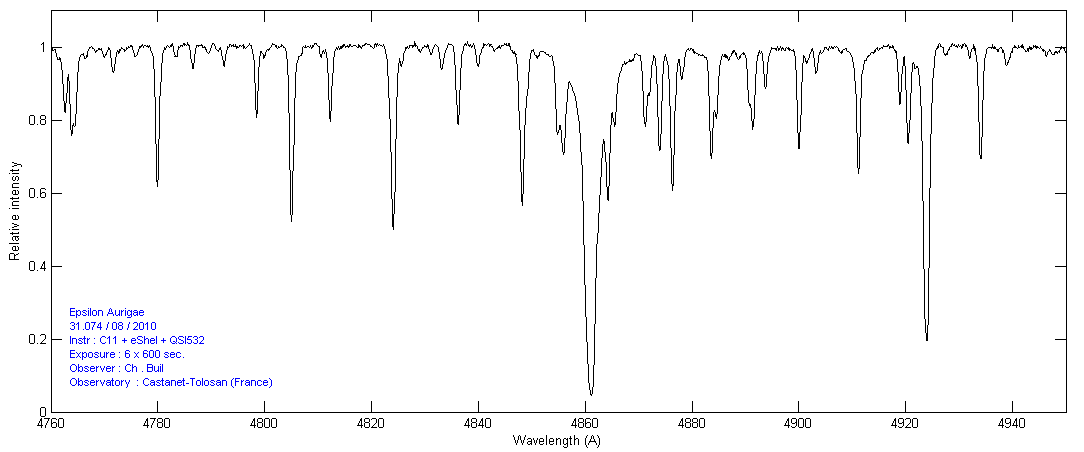
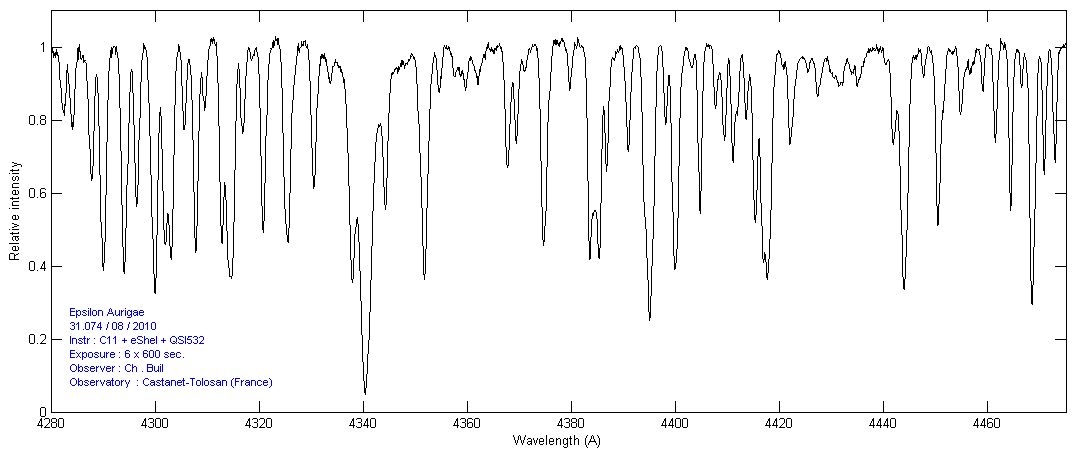
Close look of August 31, 2010
spectrum (#34)
Fast evolution
Fast
Halpha evolution.
Dynamic spectra visualisation

Halpha
animation from JD=2455033 to JD=2455273 (click on the images for display).
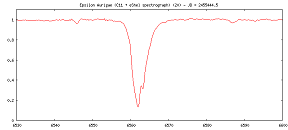
Halpha
animation from JD=2455435 to JD=2455587 (click on the images for display).


Dynamic
spectrum near Halpha line (false-colors representation) from JD=2455435 (bottom) to JD=2455587
(top).
Note the presence of a nearly 86-days pulsation for the F star.
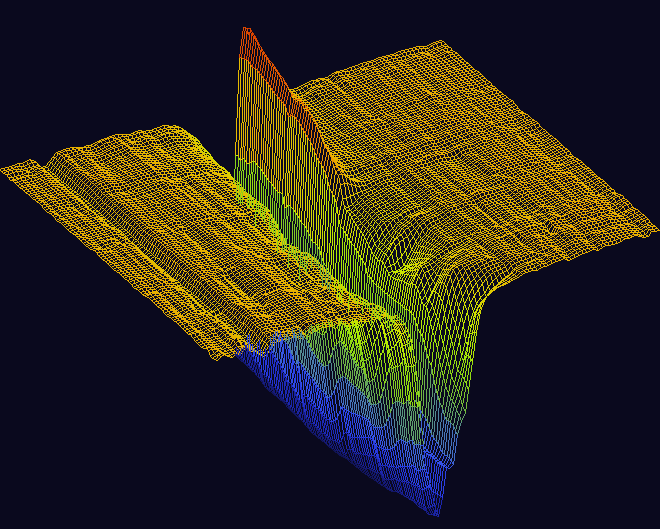
3D Halpha evolution from JD=2455435 to JD=2455587.

Dynamic spectrum around 5650 A wavelength (false-colors representation) from JD=2455435 (bottom) to JD=2455535 (top).
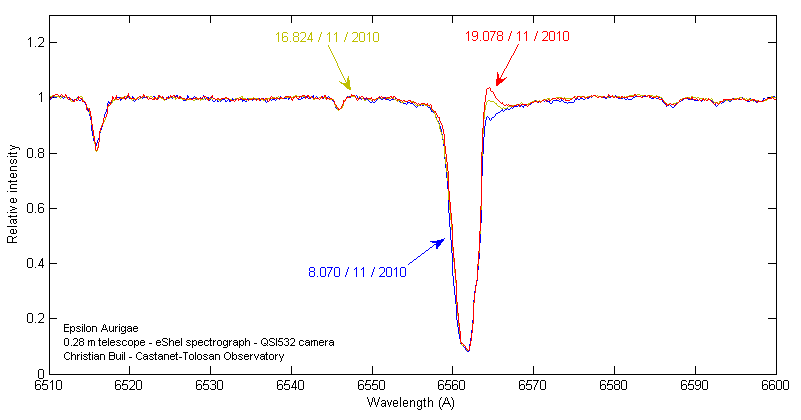
Detail
of the very fast Nov. 2010 event on the Ha
red wing.
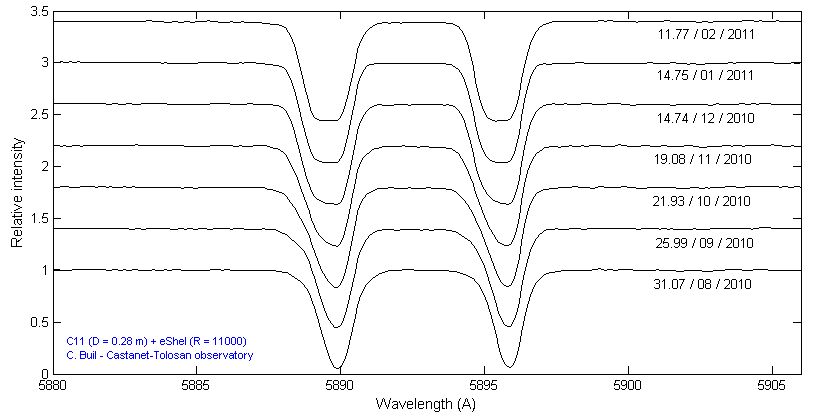
Temporal
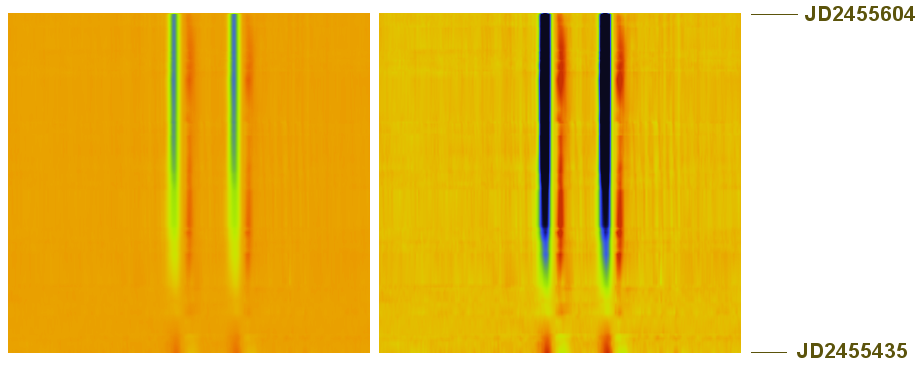
evolution of Na I (D1 & D2) lines.
Difference
2D time evolution of Na I (D1 & D2) lines for two display contrast.
The image is constructed from the difference
of the date spectrum (September 2010 to February
2011) and
a mean spectrum computed with data taken from Sept 5,
2010 to September 20, 2010.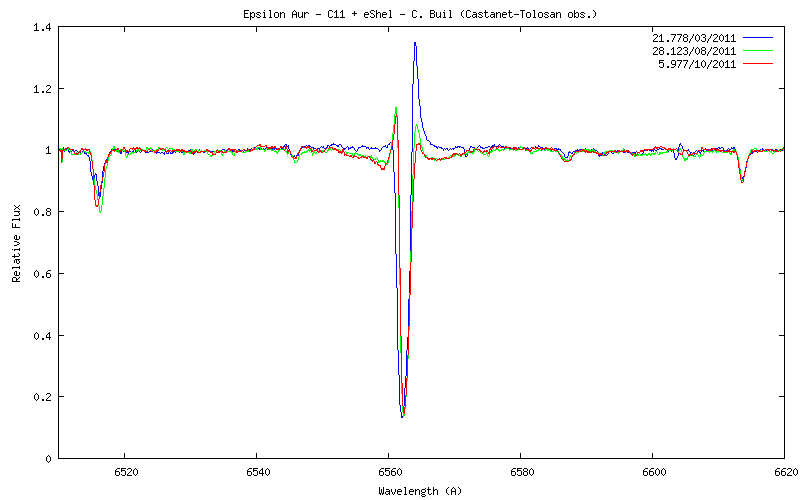
2011
Halpha activity.