Star Analyser spectra optimised acquisition
Cliquer ici pour une version en franšais de ce texte
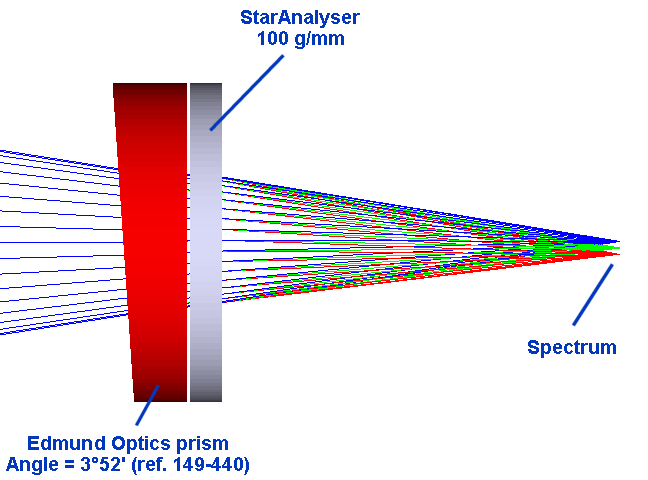
The easiest way to acquire a star spectrum is to interpose in the convergent beam of the telescope, not far in front of the detector, a diffraction grating. The grating StarAnalyser is particularly effective because characteristics of its dispersive power (a grating of 100 grooves / mm), its high efficiency (blaze) and low price. The device can be significantly improved by combining to the grating itself a prism which disperses the light in a inverse maner. It is well known as an optical setup called "grism". An optical property of the system is to cancel the chromatic coma for wavelength not deflected by the device. The theory is described here.

A grism setup in a convergent beam.
Another interesting improvement and less known is to complete the device by a filter that removes infrared radiation (an "order" filter). For example, the UV / IR rejection filter of Baader company.
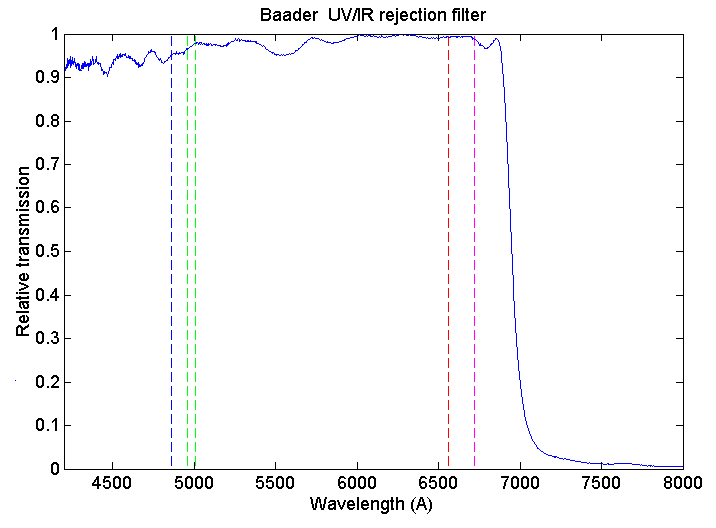
Optical transmission of Baader
infrared cut filter. The filter becomes almost opaque beyond the wavelength of 700 nm.
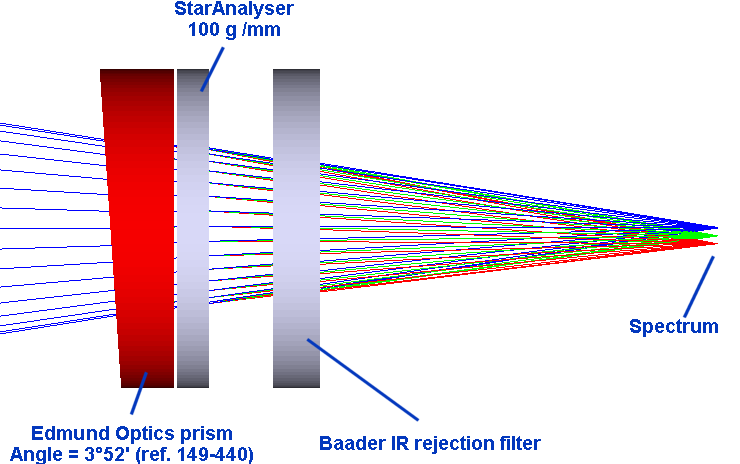
The optical system of the grism in the convergent beam supplemented by an infrared cutoff filter.
The IR-cut filter eliminates part of the spectrum where the order 1
is mixed with a diffracted order 2. In fact, a StarAnalyser
grating, because of this mix of orders can not be used for all wavelengths above 750 nm due to the spectral sensitivity of CCD cameras in the current blue. The addition of the IR cut filter limits the spectrum to the segment directly usable, which makes the images less confusing. Finally, it becomes possible to exploit the order 2
(the prism
optimizes the quality of the spectrum in the green for order
#1, but also in blue for the order #2).
The assembly may be mounted in the turret filter holder of a CCD camera. In the example below we show the situation
of QSI-583
camera. The setup efficiency
is demonstrated on a small high quality
refractor: the
Takahashi FSQ-85ED (D = 85 mm F / 5,3).
|
|
|
The acquisition setup.
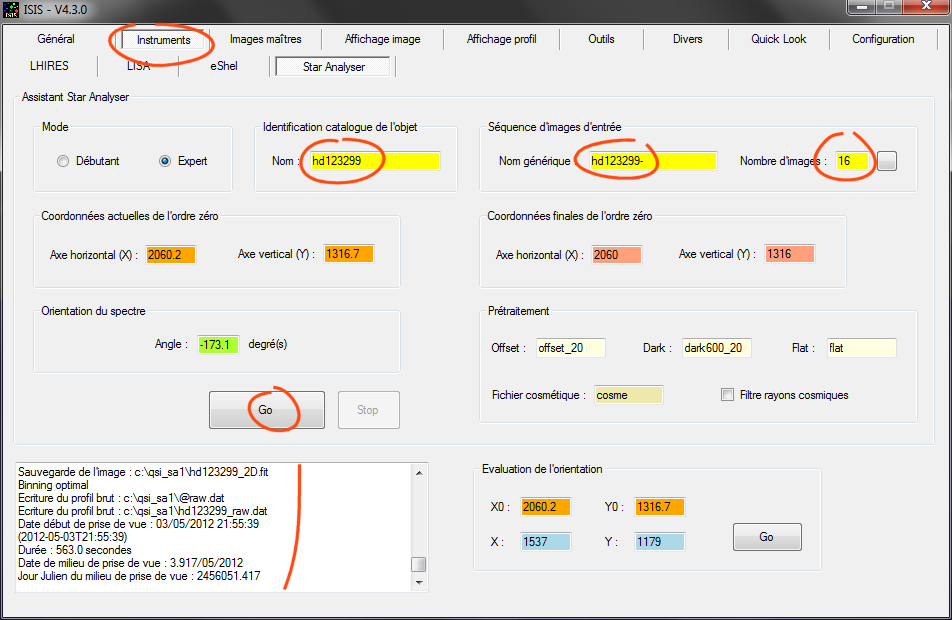
Part of raw image below is typical of spectra acquired with this device. The observed object is the star HD123299 of spectral type A0III and magnitude 3.7. The exposure time is of 7 seconds (this value is chosen to avoid saturation of the spectrum). It may be emphasized that the setting is poor: the dispersion axis is not horizontal, which is a fault.

Raw
spectrum of HD123299 taken the StarAnalyser + prism + order filtre.
|
|
Detail of the 2D spectrum

Below the spectrum of the star HD123299 with a contrast visualization for reviewing order +1:

|
|
|
On the left, the spectrum of HD123299 corrected for the instrumental
spectral response.
Right, comparison with the spectrum expected of HD123299 - in
red (from the base of Miles ISIS).
Here's a sample of spectra acquired with the device described above. First, the spectrum of the supernova SN2012aw in the galaxy Messier 95. The nearly full Moon was very close to the object for the date. Added to the light pollution of the observatory (Castanet-Tolosan, nearly Toulouse city), noise picture of the sky background is consequently high, which does not prevent detection of the supernova:
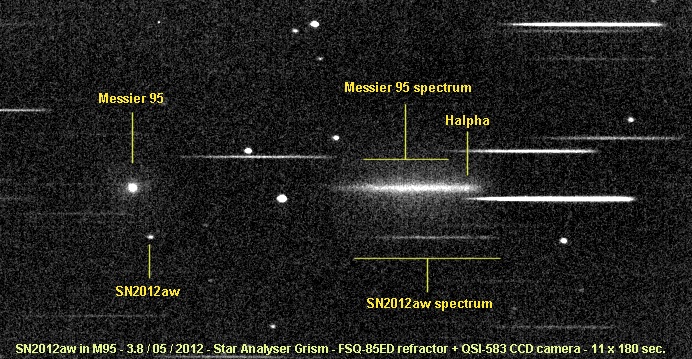
Spectrum of the supernova SN2012aw. For
more resolved spectra, click here. Note the Halpha in emission in
the diffuse spectrum of the galaxy M95.
The spectrum of the nova Sgr 2012 4.4 May 2012 while the object is at magnitude V = 12.8:
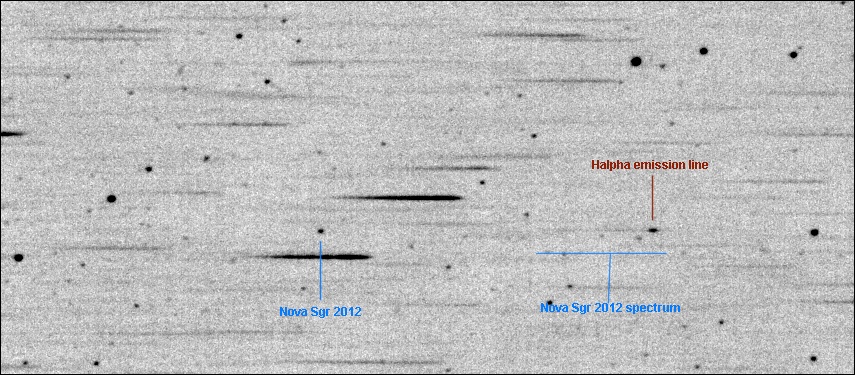
The spectrum of the nova Sgr 2012 is mainly dominated by an intense Halpha emission. Expsoure
of 10 x 180 seconds, while the object is very low on the horizon.
For more information on this subject (spectra LISA), click here.
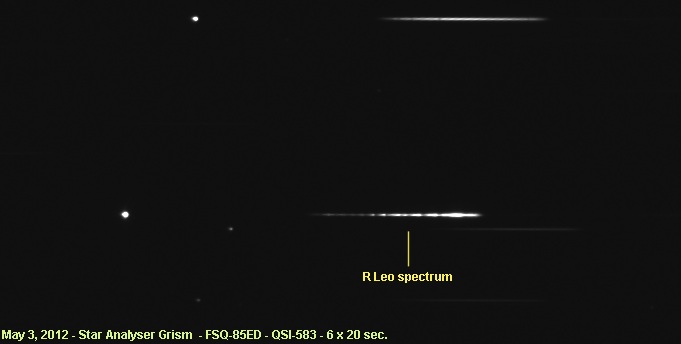
The spectrum of the star Mira R Leo, a very red object visually:
The spectrum of planetary nebula Messier 57:
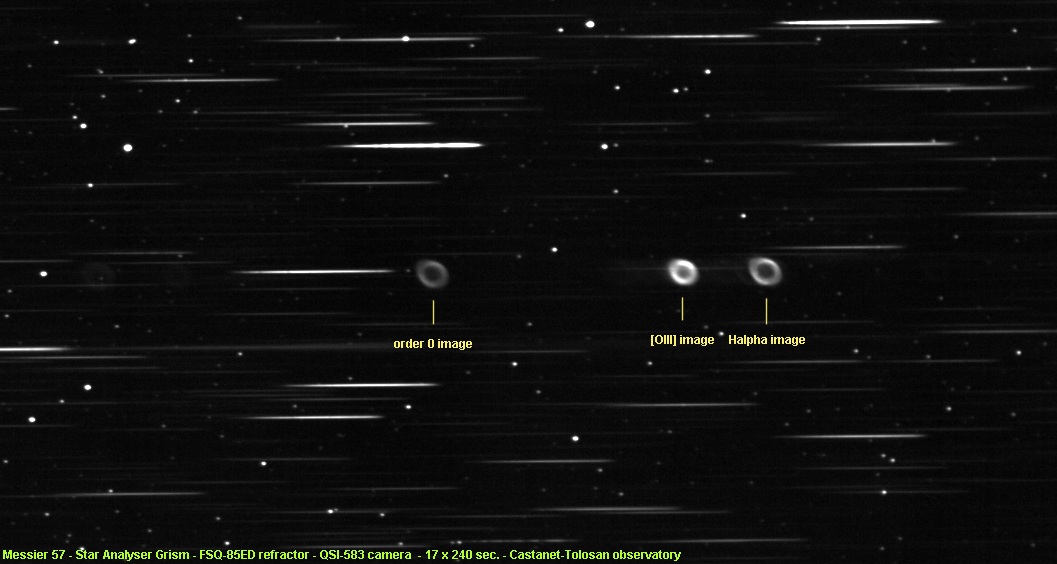
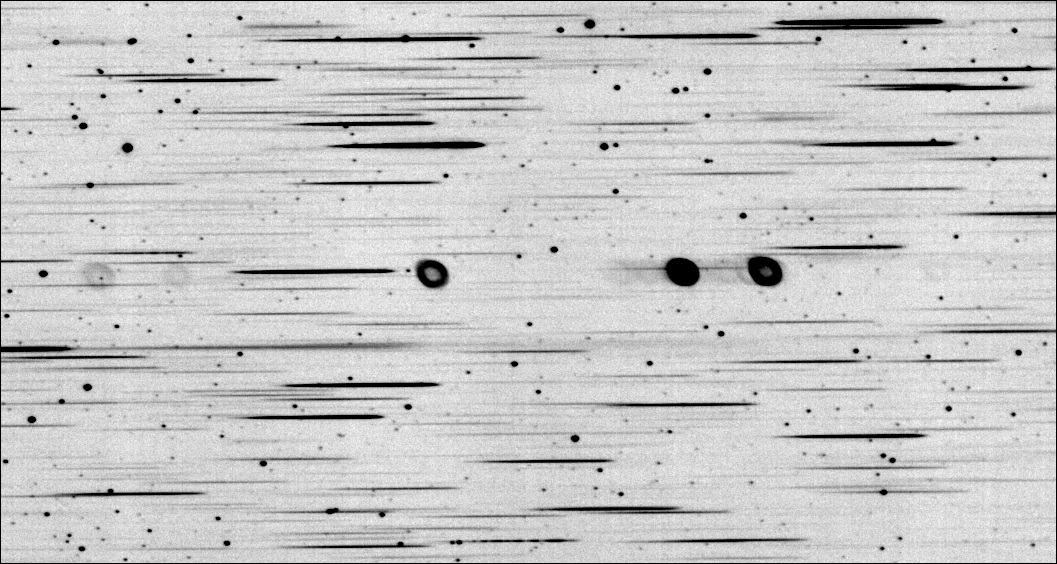
Spectrum of Messier 57 (exposure: 17 x 240 seconds). At the top, normal display.
The spectrum is dominated by the Halpha line and forbidden ionized doublet
oxygen two times (green).
Down, a negative display with
high contrast: more
monochromatic images of low intensities were found.
The spectrum of hot peculiar stars Wolf-Rayet 134 and Wolf-Rayet 135:

WR134 (V = 8.0) and WR 135 (V = 8.5). For more
details on these stars click here. Note the finespectra delivered
by the system. Exposure:
18 x 100 seconds.
Spectrum of the symbiotic star CH Cyg - 9 poses x 90 seconds (more details on this star here):
