
Spectral data preprocessing tutorial
We will use the Iris software for spectral data preprocessing coming from the a moderate high resolution spectrograph (click here for details about this device - R=3000 configuration).
The following raw images are extracted from a sequence of 13 frames of the H-alpha region for the Be star HD245535 (H2456-1 to H2456-12). The exposure ime is 120 seconds for each frame with a KAF-0401E Audine camera and the 190 mm telescope.


The first stage of the preprocessing is very traditional: subtraction of the offset and the dark signal, then division by the flat-field.
The second stage is more specific to the spectral
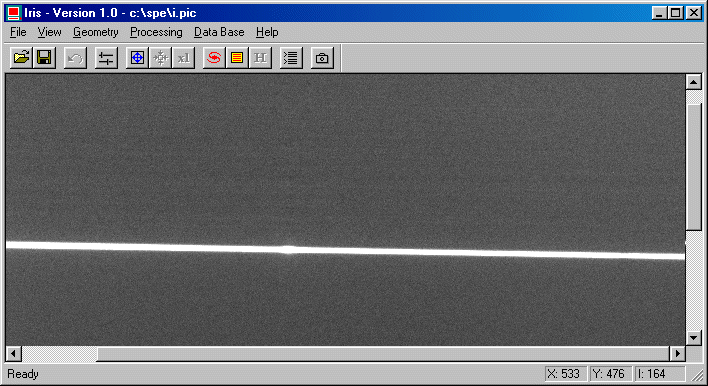
images. One can note that dispersion direction is not confused with the horizontal
axis (tilt of the grating line relative to the CCD array). It is first of all
necessary to know this angle by using L_ROT command. First of all, select a
large portion of the spectrum (by using the first frame for example), then execute
the L_ROT command which give the spectral dispersion angle relative to the CCD
lines. Here one finds 0.93°.
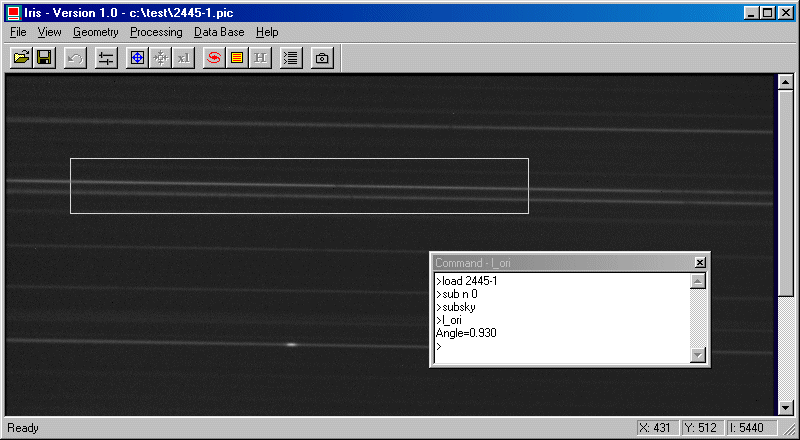
It is then necessary to turn the spectra with the angle found previously by using command ROT2 (the coordinates of the rotation center are selected roughly in the CCD center):
ROT2 2445- I 350 250 93 13
For the present time, it is necessary to carry out the registration of the spectra with the aim of an emission line (it is the case here) or an absorption line. L_REGISTER command is a fundamental tool here. Define first with the mouse a rectangle in the line region of the first frame, then execute L_REGISTER:
L_REGISTER I J 1 9 13
The frames J1 to J13 should then be added (by possibly selecting the best one and by checking that the sum do not saturate, i.e. max cumulated signal < 32767). It is possible to use command ADD2 or better still COMPOSIT:
COMPOSIT J 1.7 1 13
It is now very important to zeroing the sky background level. It is essential to determine the photometric parameters of the spectrum:
BG
NOFFSET -340
or:
NOFFSET 0
Save the result:
SAVE R
We then will calculate the spectral profile by
carrying out a binning along the transverse axis. The width of the binning is
estimated to include the
major part of the useful signal (>95%). Here this width is of 6 pixels approximately.
For example:
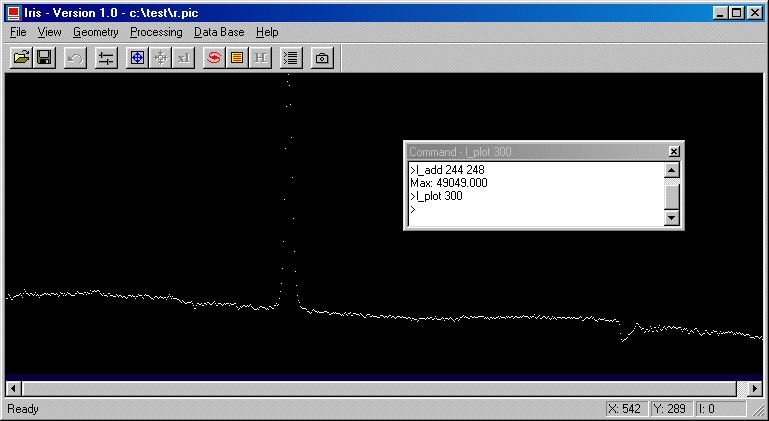
L_ADD 244 248
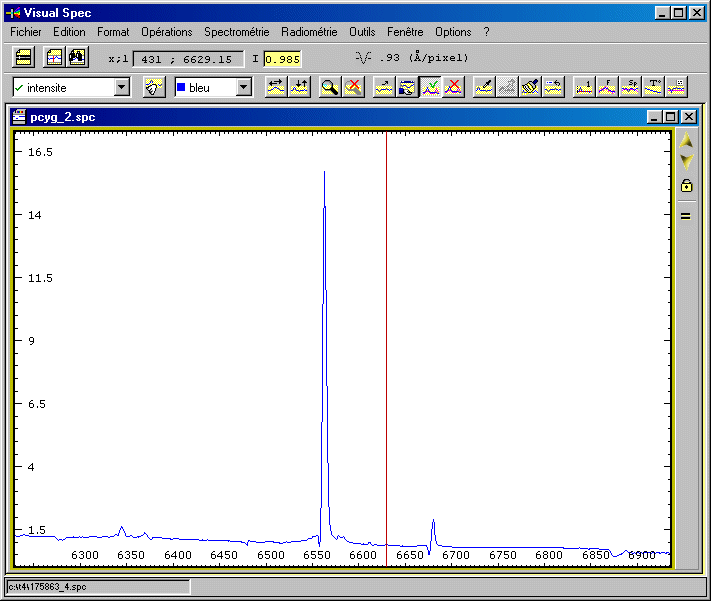
Finally we plot the spectral profile itself with L_PLOT command. This also produced the ASCII file plot.lst in the current directory.
Note the existence of the fully automated FULL_SPEC command for a very fast preprocessing (FULL_SPEC include all the preceeding actions):
FULL_SPEC 2445- I DARK FLAT 5390 0.93 1 9 13
DARK is the thermal signal map, FLAT is the flat-field map and 5390 is the mean level of the offset signal. It is necessary to rotate the spectrum of an angle of 0.93°. We use an emission line for register (flag=1). The FWHM of the line is 9 pixels.
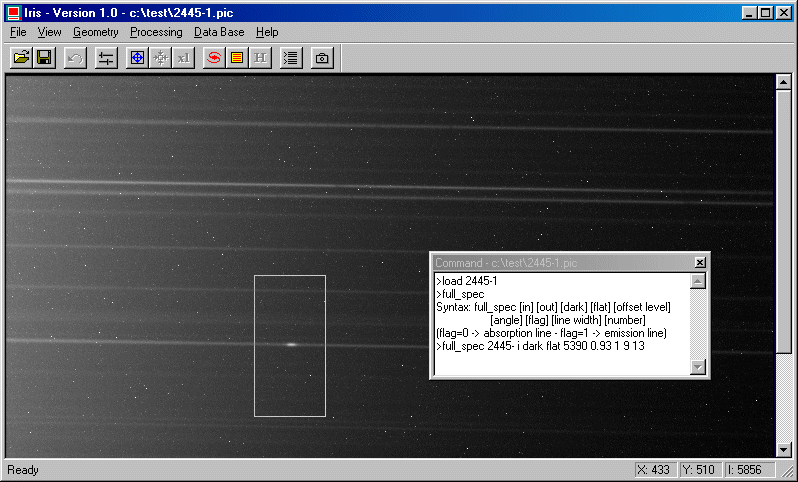
The spectrum after FULL_SPEC and an optimal co-adding:
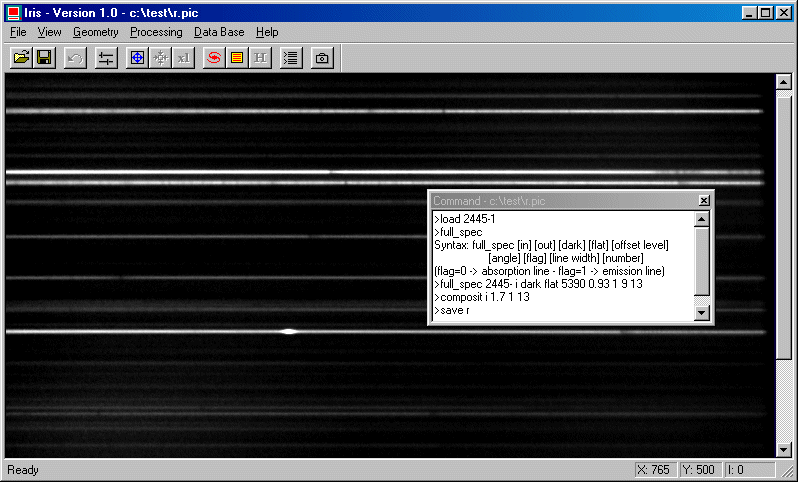
The binning operation:
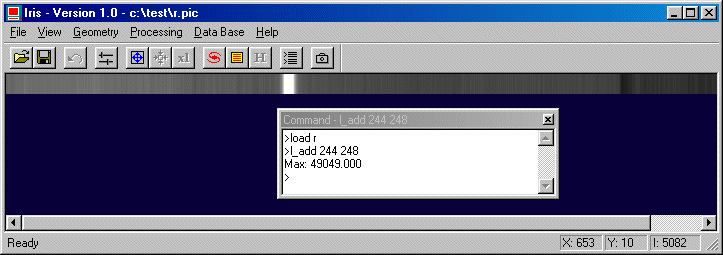
The profile below show the result of the 12 co-added images:
I do not use a shutter, so smearing effects is introduced at the reading stage of the CCD. Smearing is especially sensitive with brigth stars (m<4 with my installation). In the following figure one can see the spectrum of Gamma Cas (raw 20 seconds exposure). The smearing produces a signal dependent offset on one side of the spectrum, which is problematic for the photometric calibration of the spectra.
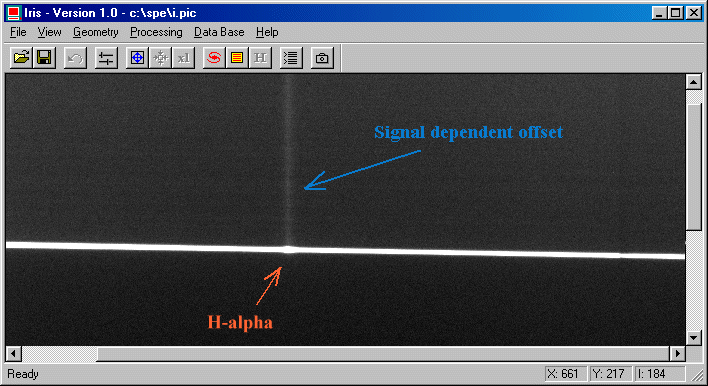
The signal of star and the signal dependent offset are given by the raw images, so it is relative easy to inverse the problem for finds an image without the signal dependent offset. The solution of this inverse problem is determined by DECONVFLAT command. The parameter of this command is the ratio between the reading time of a CCD ligne and the integration time (the ratio can be determined by successive approximation to eliminate maximum smearing effect). For example:
DECONVFLAT 0.0011
Important: It is necessary to apply DECONVFLAT command to each individual image after offset and the dark signal subtractions, but before dividing by the flat-fied and rotating the images.
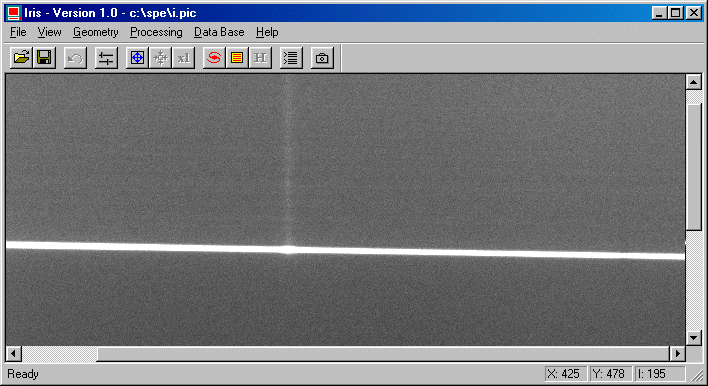
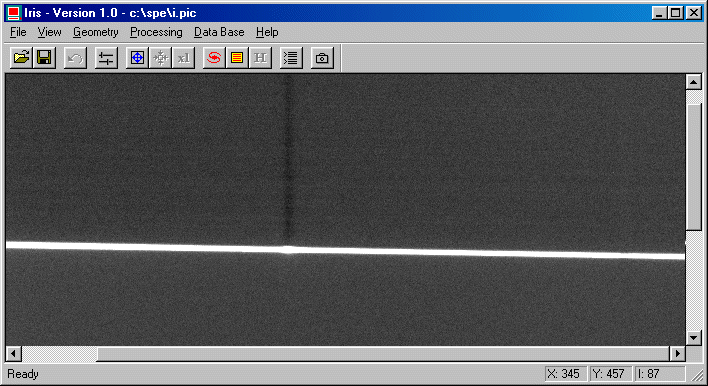
Top, the value of the parameter of DECONVFLAT is not enough high (0.0005). Center, the value of the parameter is too strong (over correction, 0.002). Bottom, the value is correct (0.0011).
Now the photometric / spectral calibrations and the exploitation of the spectra can be made with specialized softwares. I use VisualSpec, a powerful tool written by Valerie Desnoux.
For a more automated Iris version of the spectral data processing pipeline you can also refer to this pages.