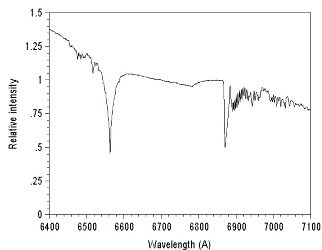
The following image shows a spectrum for Gamma Aql (spectral type K3 II). It is a mosaic of 4 elementary spectra obtained with our spectrograph @ R=3000. The spectrum's length is 2250 pixels, with a mean measured dispersion of 0.929 A/pixel. A few important spectral lines are shown: the magnesium triplet, the sodium doublet and the H-alpha line.

A spectrum for Gamma Aql. Processed using Iris and VisualSpec.

The spectral profile
for Gamma Aql from the R3000 spectrograph. This profile has not
been radiometrically scaled (the instrumental peak sensitivity is
around 5800 A). Click on the image to enlarge.
Detail of the spectral profile for Gamma Aql. Zone of the sodium doublet. The two lines, 6 A apart, are well separated. Click on the image to enlarge.
A spectrum for Vega obtained with the resolution of 3000 (dispersion is 0.929 A/mm). Grating with 1200 grooves/mm and Audine camera (click to enlarge).
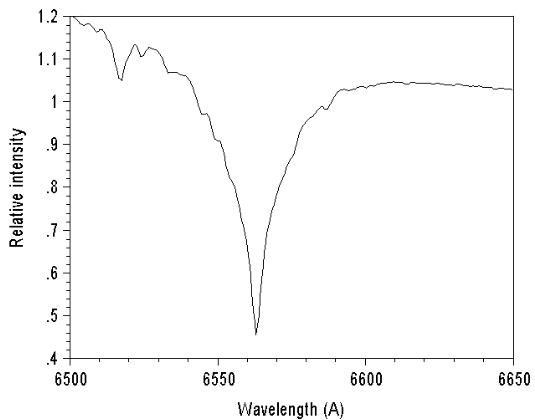
Detail of the previous spectrum around the H-alpha line from the R3000 spectrograph. The mottled aspect in the line's profile is indeed real and is caused by the presence of telluric spectral lines (H2O band).
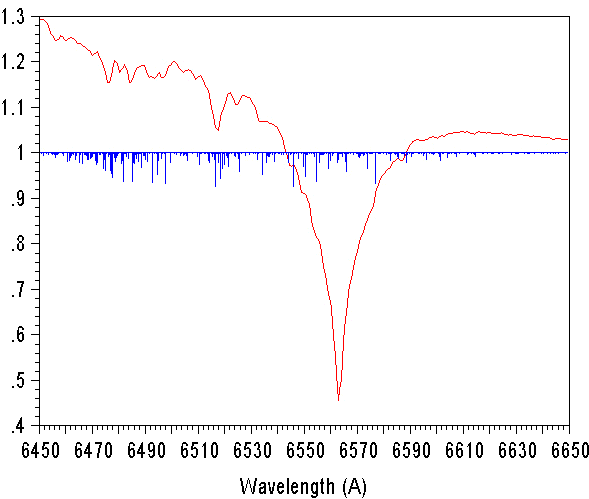
The same region in the spectrum for Vega, overlayed by the theoretical spectrum for the atmospheric H20 molecule as available in the LMD 's (Laboratoire de Météorologie Dynamique) GEISA databank. It should be noted that subtle modulations in the H-alpha spectral line are in fact due to telluric lines. By the way, water is responsible for most of the structures visible to the left of the H-alpha line.
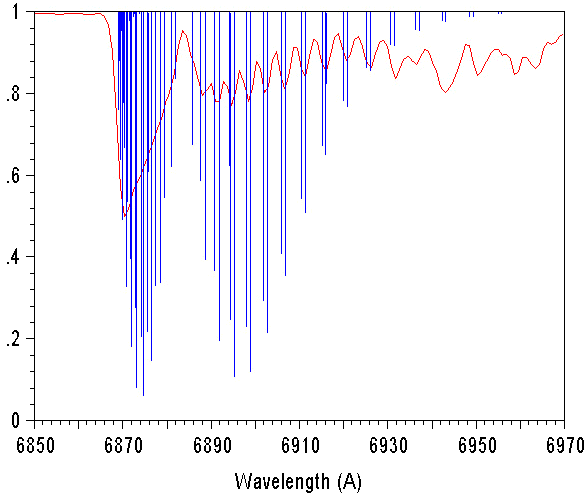
Spectral resolution test. Now the zoomed region in the spectrum for Vega is centered on the wavelength of 6890 A. Again, the aspect of this part of the spectrum is dominated by telluric lines caused this time by the O2 molecule. In blue is an overlay of this molecule's spectrum from the GEISA databank . Those two spectra are in good agreement; above 6920 A the modulations in Vega's spectrum are due to O2 (molecular oxygen). The O2 tight doublet groups are separated by about 4 A. Those structures are clearly resolved. The spectrograph's separation power is in the range of 2 to 2.5 A, in good agreement with the calculations.
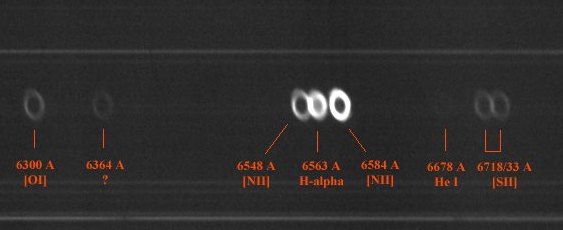
Performance in two-dimensional spectroscopy. This spectrum of the M57 nebula was carried out with a theoretical resolution of 3000. Integration time of 18 X 2 minutes.
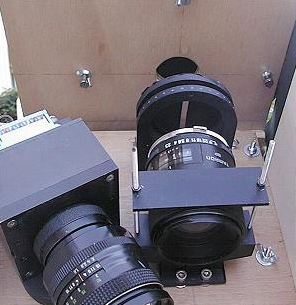
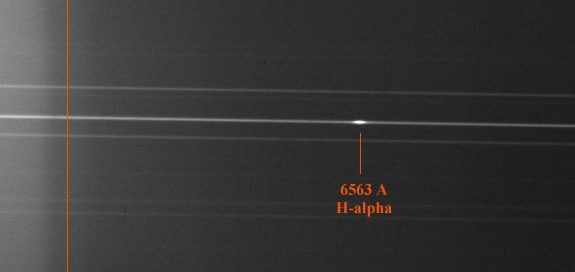
Rejection
of the sky background. At top, a 5 mm width slit was added at the
focus of the telescope. At bottom, a typical raw image (Be star
HD232552 - 12 coadded individual images exposed each 120 seconds).
The slit prevents that the light of the 5577A atomic oxygen line,
the principal component of the night sky visible spectrum,and urban
sky glow. Limit of the spectral light of sodium lamp is visible
at left (in the bleu direction).The reduction of the background
signal is about 2 to 3 thanks to this simple slit in the H-alpha
region. Since the latter is broad, the pointing of the telescope
remains simple.

