5. OBSERVATION OF SURFACE OBJECTS
5.1. Importance of the slit in the case of surface objects
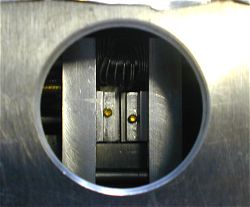
A prototype of entrance slit for the Spect'Aude.
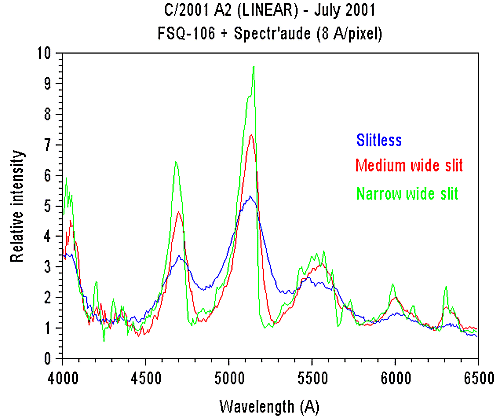
The effect on spectral resolution of entrance slit fitness is illustrated below for the situation of the observation of comet C/2001 A2 (LINEAR). The Littrow spectrograph is at the focus of a FSQ-106 Takahashi refractor (4.2 inch aperture - F/D=5). For a complete analysis of the observation of this comet click here.
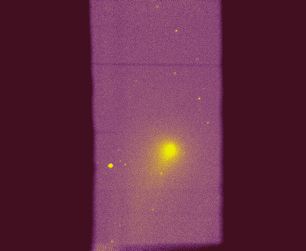
Zero order image of
Comet A2 trough a very large slit (slitless mode).
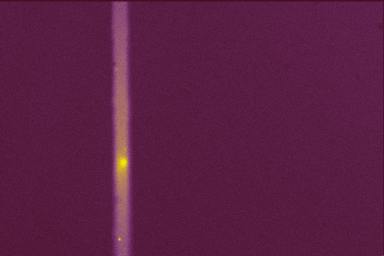
Comet A2 trough an intermediate
wide slit (not completely focused).
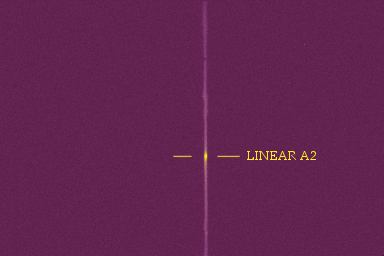
Comet A2 trough a narrow
slit (50 microns in this image).

Slitless spectral image (Castanet-Tolosan
- 29 June 2001) - composite of 7 images exposed 120 seconds each
(cumulative exposure of 14 minutes). The spectral resolution is
dominated by the size of the coma.
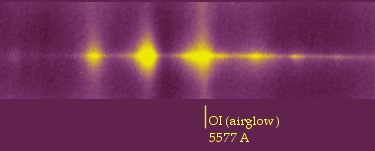
Intermediate narrow
entrance slit configuration for the spectrograph (250 microns wide).
Total exposure time of 28 minutes the 08 July 2001. The sky background
is not subtracted (note the presence of the major terrestrial atmospheric
airglow in the visible part of the spectrum).
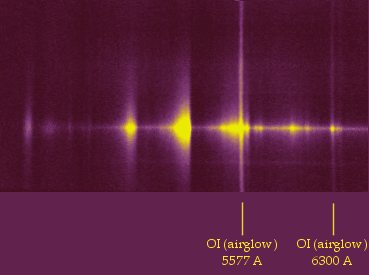
The 11 July 2001 spectra
for narrow entrance slit configuration (90 microns wide). Observation
made at Pic du Midi Observatory.
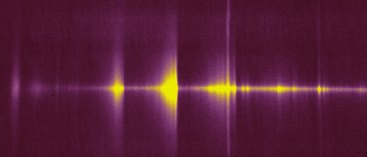
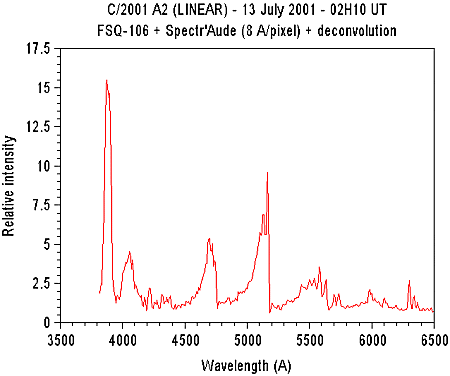
Now, for the 13 July
2001 observation, the slit wide is of 50 microns. Note the slight
increase in spectral resolution.
Spectral resolution versus entrance
slit wide. Date: slitless spectrum: 02 July 2001, medium: 08 July
2001, narrow: 11 July 2001. For this latter spectrum the FWHM is
estimated to 40A (90 microns wide slit = 7 arc-second on the sky).
Note the detection of [OI] signature at 6300A and fine structure
on the 5150 C2 swan band in the high resolution spectrum.
Deconvolution of the 13 July
spectrum (Vancittert algorithm). The spectral resolution is about
30 Angstroms (click on the image to enlarge).
5.2. Acquisition and processing procedures
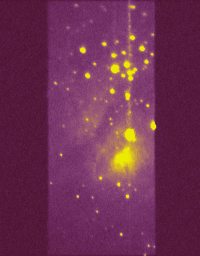
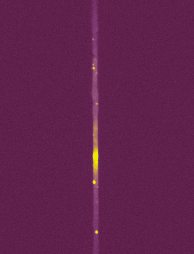
First, the object is centered
by using the zero order mode and a large slit (here the nebula M8).
Then, the slit is narrowed.
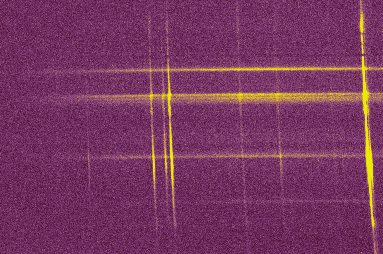
The spectrograph mode is commuted
and the spectral image is taken. Stack of 14 images exposed
60 seconds (dispersion of 8 A/pixel in this example).
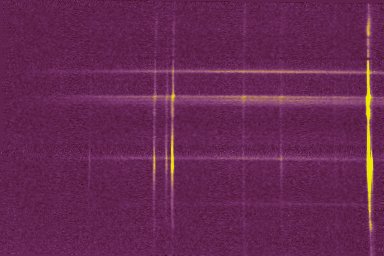
Geometrical correction of the
spectrum. The orientation of the dispersion is corrected by the
command ROT
of Iris (a command like ROT 160
100 0.75, correct a default angle of 0.75
degrees around the point of coordinates (160,100)). The inclinaison
of the spectral lines is corrected by the command SLANT (for example SLANT
100 1.9, rotate image along the line of
vertical coordinate 100 of an angle of 1.9 degrees).
![]()
Then, the spectrum is binned
(command L_ADD
for example). A binning of ten wide lines is used in the 2D image.
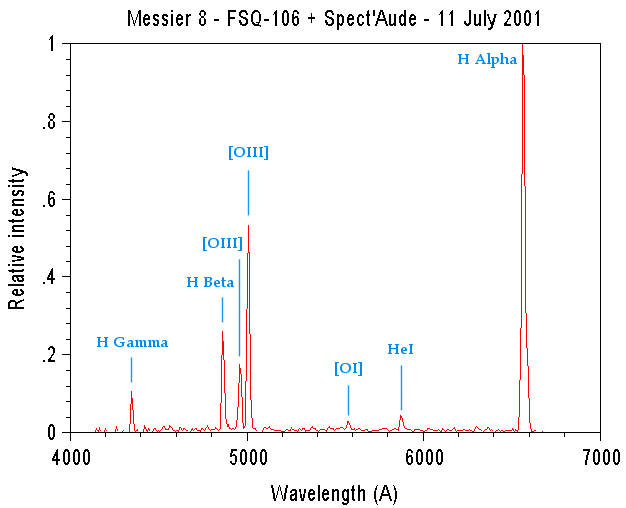
Finally VisualSpec is used to calibrate the spectral profile (radiometric correction and wavelength determinations). This spectrum show the exact relative intensity of the emission lines in the nebula Messier 8 (Lagoon nebula).
Goto index page Previous page Next page
