Theoretical
Parameters for the Design of a “Classical” Spectrograph
English translation: Steve Dearden
Version
en francais ![]()
The notes below are for a quick and simple calculation of the geometric and optical parameters for a classical spectrograph (in contrast to other mountings such as the Littrow mounting, Grism systems, etc..) These step-by-step calculations are generalized, and can therefore be adapted to other classical spectrograph designs.
Click here for download a Microsoft Excel spreadsheet for a fast calculation of the this spectrograph and a bonus ... the limit magnitude estimation !
The basic spectrograph design that we are going to consider can be seen below:
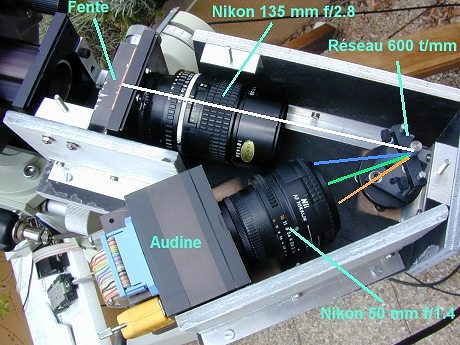
The following components are used in this design:
- A 135mm f/2.8 telephoto lens (as the collimator)
- A 50mm SLR camera lens, f/2 or faster (as the focusing lens)
- A reflection grating, 30mm square, 600lpm (e.g. Edmund Ref. NT46-075)
An optical schematic of the spectrograph is shown below:
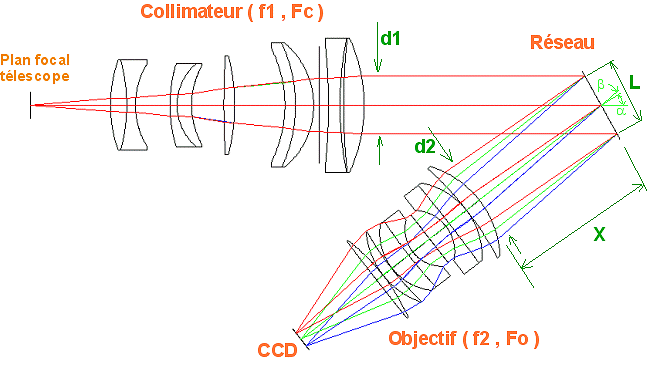
We assume that the telescope has a principal mirror of diameter (D) equal to 200mm and focal length (f) equal to 1200mm. The aperture ratio (f number) is therefore 1200/200 = 6.
D=200 mm
f=1200
mm
F#=6
Assume also that the other optical components have the following values:
For
the Collimator:
Focal length = f1 = 135 mm
f ratio = Fc = 2.8
For
the Camera Lens:
Focal length = f2 = 50 mm
f ratio = Fo = 1.4
For
the Grating:
Number of grooves = m = 600 per mm
Dimensions = H = 30 mm
STEP 1 – Check for no Vignetting at the Collimator
The collimator
lens will be large enough to pass all the light from the telescope if:
Fc < F#
Since 2.8 < 6, this condition is fully satisfied.
STEP 2 – Calculate diameter d1
d1 is the diameter of the beam exiting the collimator (refer to the figure below).
Now, 
In this case, we have

STEP 3 – Calculate the angles of incidence and diffraction
of the grating
For the visible, we want light of wavelength λ0 = 5500 angstroms to be centered on the CCD. This wavelength is known as the key (or reference) wavelength. We have essentially chosen the centre of the visible spectrum – the colour green.
Let γ be the total angle between the incident rays on the grating and the direction of diffracted for the reference ray (5500 A):

However, due to the physical size of the collimator and other components, and the need to minimise the value of the total angle γ, a value of 38° is chosen. This value is characteristic for the design, and should NOT be increased significantly.
The angle of incidence a is given by:

where k is the grating order, which can take values of …-2, -1, 0, 1, 2,… In a standard spectrograph such as ours it is strongly recommended to work in first order (k = ±1). k = 0 corresponds to the simple reflection from the grating, and in zero order the grating is acting as a mirror without dispersing the light. Note that working in zero order allows you to image the telescope field onto the detector as if the camera was placed directly at the focal plane, with an image size multiplied roughly by the coefficient f2/f1. This ratio is usually smaller than 1, so the spectrograph is behaving like a simple focal reducing lens. By rotating the grating it is therefore possible to go from the “spectrographic” mode to direct imaging, which is very useful for identifying and centring an object whose spectrum is to be recorded.
The above equation for a can be solved by rearranging so:

Entering the numerical values gives:


Thus the two possible values for α are 29.05° and 8.95° for grating orders 1 and –1 respectively. The corresponding values for β, using the relation γ = α – β, are β = –8.95° and β = -29.05°.
At this stage, we choose the solution α = 29.05°; β = -8.95° (we will see at Step 9 whether this choice is a good one).
Nb: Angles of opposite sign denote that the incident ray and the diffracted ray lie on opposite sides of the normal to the grating.
STEP 4 – Calculate the minimum necessary grating dimension
We have:

Thus:

Since L < H, no light is lost by the grating, although the 2mm margin is cutting it fine! Care and attention must still be paid to correctly align the optical components.
STEP 5 – Calculate the spectral dispersion on the CCD
Let ρ be the degree of dispersion, in Å per pixel, on the CCD. For a CCD sensor of pixel size (p) = 9 microns, the dispersion is given by

which gives

STEP 6 – Calculate diameter d2
d2 is the beam diameter of diffracted rays from the grating, and is given by

where X is the distance from the grating to the front surface of the camera lens and N is the number of pixels across the CCD in the direction of dispersion. Owing to mechanical constraints, X is equal to 60 mm. Assuming that the CCD is the Kodak KAF-0400 type, with N = 768. Therefore

For total absence of vignetting of the CCD, the condition that F0 < f2 / d2 must be fulfilled. In our case: 1.4 < 1.48. Therefore the condition is satisfied, but only just. The 50 mm camera lens has to be at full aperture, which is not the best situation for good image quality and spectral resolution. An improvement of the situation is provided in a later section.
It has to be strongly emphasised that the grating to camera lens distance (X) must be minimized as much as possible in order to eliminate vignetting and to minimise optical aberrations, whilst at the same time avoiding blocking rays from the collimator. Obviously, a compromise has to be found here.
Nb. The ratio  is called the
anamorphic factor of the spectrograph (see later).
STEP 7 – Calculate the spectral range covered
The extreme wavelength limits from one side of the CCD to the other are given by the relation:

Filling in the numbers gives λ1 = 4363 angstroms and λ2 = 6637 angstroms.
Thus the spectrograph in this configuration practically covers the whole visible region with an image size of 2.96 A/pixel. The grating must be rotated if the UV or IR regions are to be examined, so provision to accurately rotate the grating manually is an important requirement.
STEP 8 – Calculation of the Spectral Resolution
The spectral resolving power (R) is defined as

where Δλ is the smallest resolvable spectral element. The greater the value of R, the greater is the spectral detail. The current spectrograph is of medium resolution with a value of R around 1000. At this resolution, spectral lines with a separation of 6 Å in the 6000Å region (eg. the sodium doublet) can be resolved. We shall see further on if this performance is achieved.
One expression for the resolving power for a grating spectrograph is:

where r is the anamorphic factor defined earlier and FWHMt is the full width at half maximum of the image of the star on the CCD, in the direction of dispersion, assuming a monochromatic light source. If the apparent diameter of the star’s disk is limited (partially blocked) by the slit at the telescope focus, then FWHMt is the slit width projected onto the plane of the CCD (or more precisely the Line Spread Function LSF of the slit).
If the spectrograph is used without a slit (a case known Seeing Limited, meaning that it is the apparent angular size of the star that determines spectral resolution), (FWHM)t can be calculated from the following expression:

where
- φ is the astronomical seeing (in radians),
- FWHMc is the full width at half maximum in mm of the image of the point source produced by the collimator,
- FWHMo is the full width at half maximum in mm of the image of the point source produced by the camera lens,
- FWHMd is the full width at half maximum in mm of the diffracted limited PSF of the grating.
- p is the pixel size
Note : This definition of FWHM is the value that one measures in number of pixels plus fractions of pixels in the image that would then be converted to mm, knowing the pixel size.
The value of FWHMd is given by

This value is very small in our spectrograph (FWHMd=1 micron). We adopt FWHMd=0 in the example.
If the object under study is limited by the slit (the Slit Limited case, e.g., when an object of large angular extent, such as a nebula, is observed), the parameter (FWHM)t is given by:

where ω is the slit width at the telescope focus.
Moreover, if (FWHM)t < 2 × pixel size p,
then the spectrum is said to be “undersampled” according to Nyquist theory,
meaning that the final resolution is governed by the pixel size, and in this
case we will have 
With standard
photographic lenses and the f ratio of the telescope entering the spectrograph
equal to f/6 (see earlier) we typically have
FWHMc = 10 microns (0.010 mm) and FWHMo
= 15 microns (0.015 mm).
Nb. The camera lens is working at a greater aperture (lower f number) than the collimator, which gives rise to the difference in the above FWHM values.
p value for the Kodak KAF-0400 CCD chip is 9 microns (0.009 mm).
Assume that the atmospheric seeing is 4 seconds of arc, a relatively poor value, but one corresponding to typical skies for amateurs and for long exposures; it also accounts for telescope guiding errors and flexure. In radians, this gives φ = 2 x 10⁻⁵ rd.
Recalling the other parameters:
f = 1200 mm,
f1 = 135 mm,
f2 = 50 mm,
and the anamorphic factor, given by

Inputting the numbers gives

Therefore the size of a star at 5500 angstroms in the dispersion direction is 19.5 microns, or about twice the FWHM of 2 pixels. This is a good value since the smallest resolvable detail must cover at least two sample elements in order to be detected.
Thus, the final expression for the spectral resolving power R is:

Note that for a slit-less spectrograph, the key to high resolution is to employ a telescope with a relatively short focal length. If f = 500 mm if then becomes possible to use a collimator with f1 = 50 mm without appreciable loss in spectral resolving power under average (4 arcsec) seeing conditions. With modern apochromatic refractors, the aperture ratio is typically around F#8.
For example I
uses a Takahashi fluorite refractor of diameter D = 128 mm and focal length f =
1040 mm. With F# = 8, the spectrograph’s optical components are working less at
their aperture limits (less aberrations) compared to the above calculated
example. With good quality
Nikon/Olympus/Canon lenses for a beam at F#8:
FWHMc = 8 microns =
0.008 mm (Nikkor 135 mm f/2.8)
FWHMo = 12 microns
= 0.012 mm (Nikkor 50 mm f/1.4)
In addition, with a 128 mm collimator, the astronomical seeing diameter is closer to 3 arcsec. than 4 arcsec. for typical exposure times. For all calculations made with these parameters we find FWHMt = 16.0 microns. The apparent diameter of the star is smaller than two pixels on the CCD, although the effective resolution is limited by the detector itself. When such under-sampling occurs, the value to adopt for FWHMt is 2 × p = 2 × 9 microns or 18 microns. The attainable resolving power is therefore equal to 920 (and for this particular optical configuration it is the maximum possible value given the pixel size of the CCD chip). There is an advantage in working with a slight under-sampled spectrum – for a spectrograph with a wide slit width the observed line profile is relatively independent of variations in seeing (atmospheric turbulence) over ranges of several tens of percent, which is important when analysis and interpretation of the astrophysical data is made. Avoiding the necessity of narrow slit widths smaller than 10 microns or so in stellar spectroscopy is a considerable advantage in efficiency and use of the spectrograph and is the sole domain of the small-to-medium sized telescopes of the amateur. (The only real drawback of not using a narrow slit on a small telescope is that spectral calibration is rendered more difficult, where unambiguous identification of spectral lines in the acquired spectrum is required.).
STEP 9 – Choice of Anamorphic Factor
Somewhat arbitrarily we chose the following angles in Step 3:
α = 29.05° and β = -8.95°.
We will now see if this was right correct choice with respect to the other possible solution: α = 8.95° & β = -29.5°.
Let us determine the image of the star on the CCD and the resolving power with the new values. Applying the equations used in Step 8, we obtain the following values:

giving FWHMt = 20.60 microns and R = 920.
The Full Width at Half Maximum of the star image on the detector has slightly increased (20.6μ versus 19.5μ) thereby reducing the resolving power. However, since the anamorphic factor (r) is now > 1, this has the effect of increasing the spectral dispersion. Re-using the equation from Step 5, we obtain:

instead of the value of 2.96 Å/pixel obtained before. This increase in spectral dispersion compensates for the wider star image (or the wider slit image) and in fact the latter case with r > 1 produces a slightly higher resolving power than the case r < 1. This advantage is always worth using, even though a higher dispersion is not always the final objective (because high dispersion = lower limiting stellar magnitude possible). Thus, if we want to achieve the highest spectral resolving power for our example, we should use in the end a configuration with α = 8.95° and β = -29.05°. (Note that this is NOT a general result – the same calculations must be performed for every spectrograph configuration that is envisaged.)
It must also be emphasised, moreover, that the calculation of d2 with the new parameters (see Step 6) gives 28.2 mm, which is significantly smaller than the value of 33.7 mm obtained previously. The beam from the grating that enters the camera lens is less spread, thus the camera aperture required is smaller and lens aberrations less of a problem. This is an additional advantage in choosing the last values for α and β.
STEP 10 – Easy Ways to Increase the Resolving Power
In all the previous calculations the main factor limiting the resolving power is the physical size of the pixels of the CCD chip. Without modifying or changing everything in the spectrograph the simplest way to increase the resolving power is to increase the groove density of the grating. A 1200 lpm grating will more than double the spectral resolution.
Maintaining the total angle to 38° (the main geometry of the spectrograph does not change), we find α = 1.43° and β = 39.43°. Note in particular that the incident and diffracted rays are now on the same side of the grating (the signs of the angles are the same).
Going through the calculations as before, we will see that the grating dimensions are sufficient, that diameter d2 = 25.7 mm, requiring the camera lens to work at f/1.9 to avoid vignetting, that the spectral dispersion equals 1.16 Å/pixel and that the resolving power is equal to 1990. This is fine, but remember also that using a 1200 lpm grating loses about one magnitude in light sensitivity compared to a grating of 600 lpm. The judicious choice of which grating to use will depend on the type of observations to be made. Click here for the computation of the limit magnitude.
STEP 11 – Some Variations
The figure below shows a variant on the original design that produces similar image quality but replaces the rather large and heavy telephoto lens with a simple achromat doublet lens as the collimator. This results in a more compact design than before. Whilst the distance X is the same (60 mm), the grating can now be much closer to the front surface of the collimator since it now takes up much less space. A typical source for the doublet lens is Edmund, with a focal length of 100 mm and 25 mm in diameter (Ref. E32-327). For rays close to or on the principal optical axis, the image quality produced by the doublet lens is the same as that of the telephoto lens.
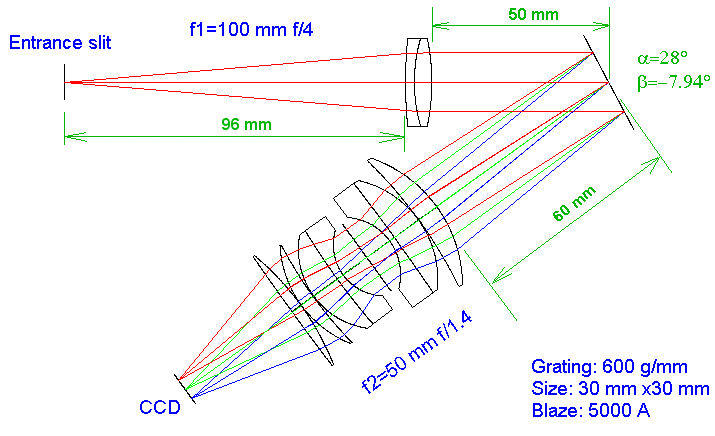
The next diagram (below) shows what happens when the spectrograph functions in wide-field mode, corresponding to slit-less observation of many stars simultaneously. Here the spectrograph accepts a field of ±3 mm at the telescope focus without any vignetting (about 0.3Å for a telescope of 1200 mm focal length).
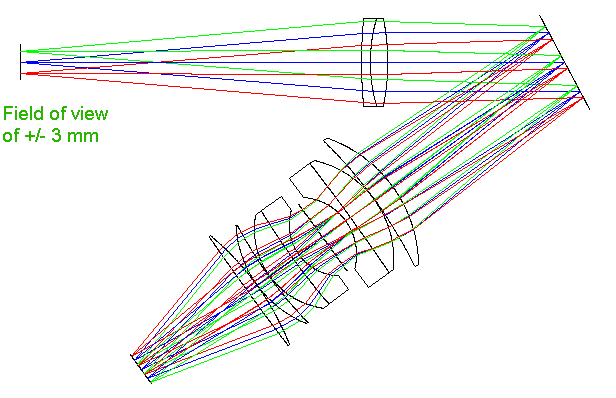
By moving the collimator closer to the grating lets us image almost the full exit pupil of the telescope on the entrance pupil of the camera lens, which is an excellent means of reducing off-axis aberrations. In other words, if we were to place a screen just in front of the camera lens we would see in this position the sharp contours of the telescope primary (mirror or objective). In order to carry out this type of “entrance/exit pupil” imaging, the following conditions are needed:
·
If X’ =
distance between the grating and the front surface of the collimator lens
·
and X =
distance between the grating and the front surface of the camera lens,
the condition  must be satisfied approximately.
In this example we have X’ = 50 mm, X = 60 mm and f1 = 100 mm, which is within 10 mm of the relation and close enough to correctly image the telescope exit pupil in the plane.
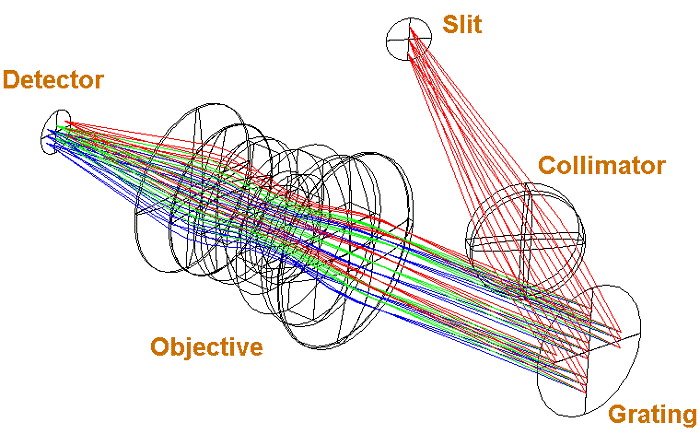
The following figure is a 3D ray trace of the spectrograph. We can see how the entrance slit is oriented and how the spectrum is produced on the CCD.
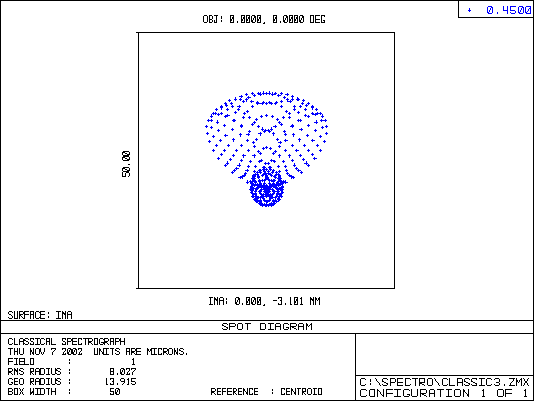
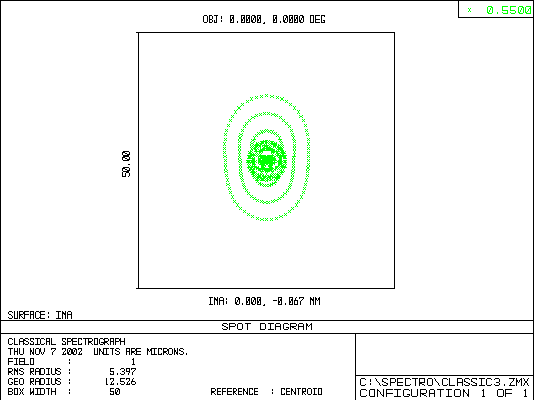
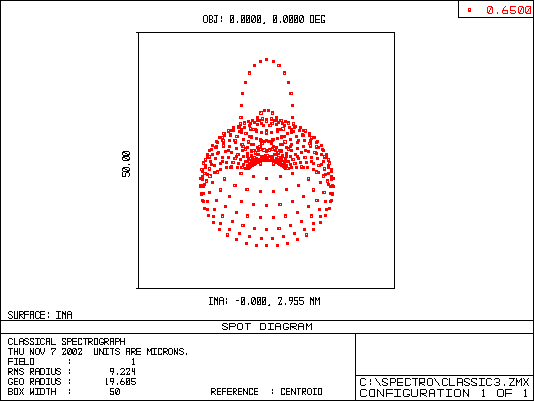
Lastly, the three figures below are spot diagrams for three wavelengths in the blue, green and red regions of the spectrum. FWHM of the images is between 15 to 20 microns in the visible region. These values are acceptable in view of the sampling requirement for 9 micron pixels – the FWHM image should cover ~2 pixels for optimum (Nyquist) sampling. Under standard seeing conditions, the spectral resolution is not significantly degraded, as we have seen earlier.
STEP 12 – Testing
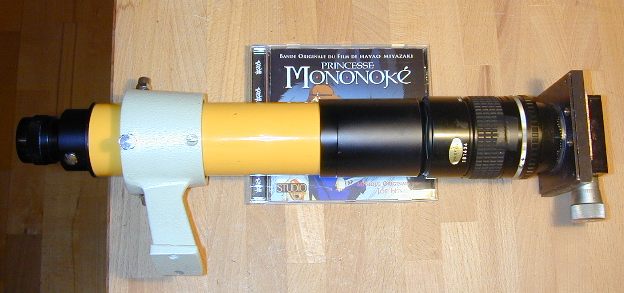
The only important adjustment to make on the spectrograph is to ensure that the image of the slit is at infinity as seen by the collimator – in other words, the rays are parallel before incident on the grating. Using a good-quality finder-scope, focused at infinity, and placed in front of the telephoto (collimator) lens, adjust the focusing barrel of the telephoto lens until the slit image is in sharp focus (see photo.).
An entrance slit is always a important component in a spectrograph. Even a basic design consisting of two razor blades can be useful. The slit fulfils the following functions in the spectrograph:
- It isolates the object under study
from its neighbours (relatively large slit widths – few tenths of 1 mm to
several mm – will achieve this).
- It reduces the sky background in
order to increase spectrum contrast (also achieved by wide slits).
- It limits the region to be analysed
in order not to degrade spectral resolution – see Step 8 – useful for
extended objects such as nebulae and comets.
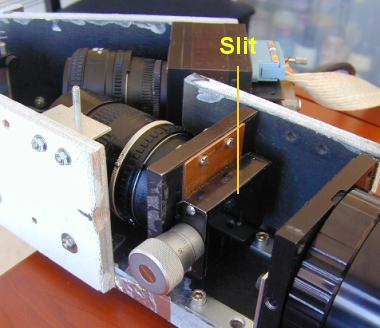
- Adjustments to the spectrograph can be made in subdued daylight, without saturating the CCD detector.
Point D above is illustrated below. Our spectrograph is equipped with a micrometer-adjustable variable slit (see photo). This useful device was obtained from some scrap lab equipment, but anyone with DIY talent can probably make something similar.
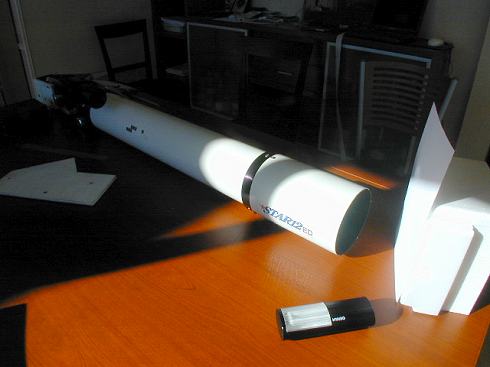
Initial testing of the spectrograph is best carried out in subdued daylight. In this case, the spectrograph can be seen mounted at the end of a 120-mm refractor (F/D = 8.5):
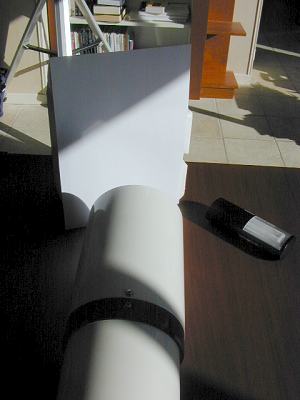
The target object is simply a white sheet of paper illuminated either by sunlight or by lamp that has some emission lines in its spectrum (e.g. a pocket OSRAM fluorescent lamp has fairly strong Hg emission lines):
The following examples were obtained with a 1200 lpm grating in the spectrograph. The slit was closed down to only a few tens of microns. So narrow a entrance slit will have no effect on the final resolving power, and the measured resolution will therefore be determined by the intrinsic characteristics of the other parameters of the system. The refractor used in the test has no direct influence on the resolution since it is simply playing the role of light collector from the source. Using the telescope will however ensure that the beam aperture entering the spectrograph is a known and controlled value. In this case we have F# = 8.5. It is therefore most important to get as close as possible to actual observing conditions during the testing so as to objectively measure the performance of the system.
The image below shows the spectrograph with a 1200 lpm grating (Egmund Ref. E47-077). The total angle g = 38°. Note that the grating surface is virtually perpendicular to the optical axis of the collimator in order to disperse the light into the camera lens:
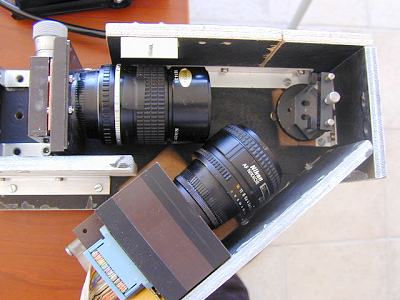
Some simple plastic lens covers, drilled with a hole, and a little Araldite, were employed to make the interfaces between the camera and the slit.
The first spectrum can be seen below, showing the green-yellow region of the Osram lamp. Some broad and diffuse emission bands, of little practical use, can be seen, but also some strong narrow emission lines due to mercury vapour in the lamp:

The 2 Hg lines in the centre are at wavelengths of 5769.60 and 5789.66 Angstroms (for the complete spectrum of this lamp, click here). The colouring in the image is false, but approximates the true colours (RAINBOW command in IRIS software). All the horizontal lines are due to small irregularities along the edges of the slit (remember that the slit width is around 10 microns only!) These horizontal structures are known as the tranversalium.
The spectral profile below is taken from the spectrum image above. The two Hg lines are clearly visible in the centre, and are well resolved (horizontal axis is in pixel number, and the dispersion in this case is 1.1 Å/pixel.

The following profile is the magnified profile around the two Hg lines. The FWHM is about 1 pixel only, close to the expected value based on the technical choices that were made in the design. Note that the line profiles or line spread functions are symmetric without excessive spreading near the baseline, signifying excellent image quality. Thus for actual observations of the sky, the only factor affecting the final resolution will be the optical quality of the telescope and the star’s apparent diameter (for a configuration without too narrow a slit width).

The next most useful target for you to familiarise yourself with the functioning of the spectrograph is diffused sunlight reflected off the white card. The multitude of Fraunhofer lines allows us to monitor the performance parameters of the instrument and to learn some of the principal solar spectral features. As an example, the image below is the solar spectrum around the magnesium triplet in the green, again with a dispersion of 1.1Å/pixel and a resolving power of 2200 at 5500Å. The wavelengths of these three lines are 5167.33, 5172.70 and 5183.61Å.
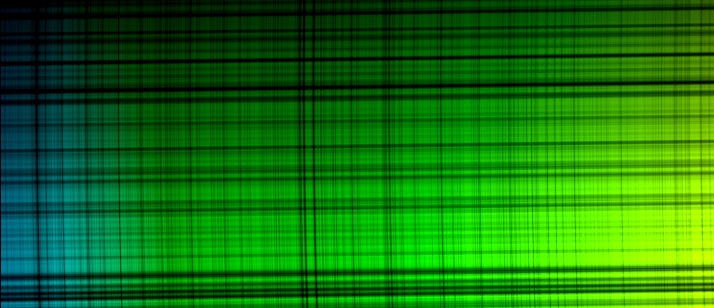
This small spectral region has a considerable number of lines. It is shown here directly as it comes from the spectrograph. A number of geometric defects are clearly visible. First of all, the transversalium is not strictly parallel to the horizontal CCD axis. A spectrum of a star would also exhibit the same degree of tilt. This problem comes from the fact that the grating grooves are not perfectly at right angles to the CCD detector axis owing to mechanical limitations in the design of the home-made grating mount. This defect would prevent optimal extraction of spectral data from the image and must be corrected for. The TILT command in IRIS can make this correction, provided that we know the tilt angle. This can be performed by trial and error, and in this case leads to a tilt of 0.75°. The spectrum, corrected for tilt, can be seen below:
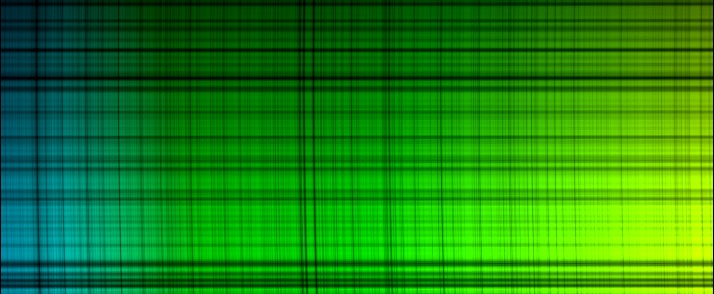
Close inspection of the lines reveals that they are slightly curved, an effect known as “smile”. This is a very common image distortion effect in spectrographs. This again must be corrected for, particularly if binning is subsequently used during spectrum extraction and no loss in resolution is desired. In IRIS, the command SMILE can be applied, which requires that we provide the radius of curvature of the lines in pixels. After several successive attempts, again by trial and error, we obtain a radius of curvature of –7000 pixels. The final image below shows the result of the SMILE command:
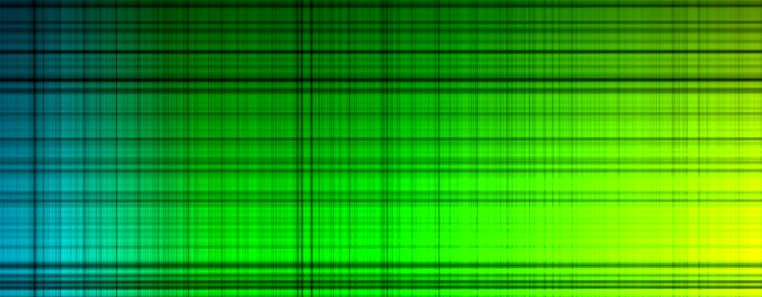
The lines are now correctly oriented and the actual spectral analysis can begin. The graph below is the spectral profile of the sun in the neighbourhood of the Mg triplet exhibiting abundant detail in the numerous lines. The lines are straight and narrow and under-sampling of the spectrum is evident. It is possible to slightly increase the resolution (about 20-30%) by taking a sequence of multiple spectra and then displacing them slightly each time with respect to the pixel position, and then applying the “drizzle” technique.

The next spectrum (below) shows the H (3933.68Å) and K (3968.49Å) lines of calcium in the UV.
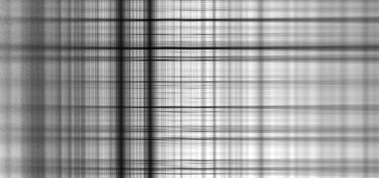
This image clearly illustrates the problem of chromatic aberration with the dioptric photographic lenses used in the spectrograph. In the UV region, regions of sharp focus are strongly wavelength dependent. However, everyday consumer camera lenses are designed to produce sharp images on photographic film in the visible. The calcium H- and K-line region lies well outside their normal field of application. By turning the focusing barrel of the camera lens it is possible to achieve focus on the H and K lines, but lines either side of this region will rapidly become blurred. The problem of chromatic aberration also exists in the infra-red region, but fortunately the wavelength dependency of focus in the IR is less sensitive, as we shall see below.
The spectrum below is of the H-alpha region in the red (the intense line to the left of centre). The large band to the right is due to atmospheric oxygen (wavelength 7600Å).

Over the area covered by this spectrum, which extends to the deep red (between 6230Å and 7100Å), it appears that the Nikon lenses used perform very well and there is no need to correct for good focus.
Going further into the IR, the spectrum below shows the sun between 7200Å and 8000Å. The atmospheric O2 band is visible in the centre, and the effects of chromatic aberration are still fairly weak.

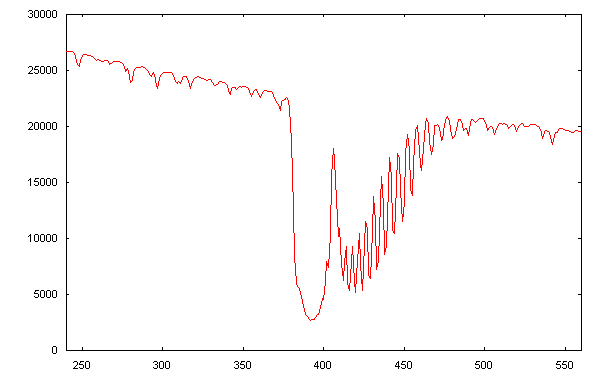
Finally, here is the spectral profile of the O2 band at 7605 Å:
Our spectrograph
is now ready for use and can observe its first real stars! You will find here
an example of a high-resolution application, and here, an example of a
low-resolution application.