4.3. Importation of 1-D spectral image
From the graphical interface of VisualSpec, to load 1-D spectral image, use the Open Image command in the File menu. The spectral profile itself is extracted by clicking on the Binning Objet button:
The spectral calibration consists of assigning the wavelength to each point of the spectral profile. The calibration can be carried out using 1, 2 or 3 lines, according to the number of recognizable lines in the profile or according to whether the dispersion law is already known. The following figure shows the rough spectrum of the Vega star carried out with the spectr' aude at a dispersion of 0.38Å/pixel.
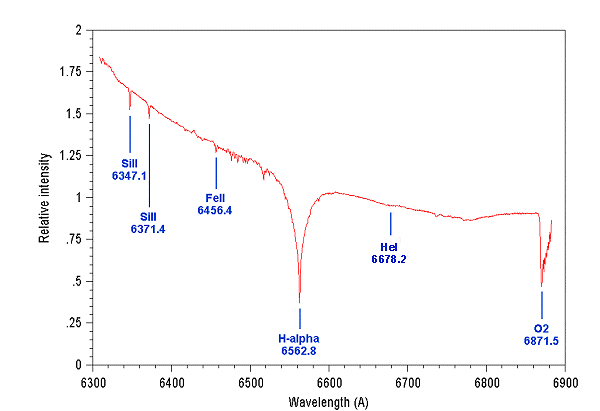
In the spectral field covered around the line Ha some well marked spectral lines can be noticed. The line of helium at 6678.2 angströms is very weak in the spectrum of Vega, but sometimes quite remarquable in the spectrum of the Be stars. It is however much more preferable to use telluric lines (lines of terrestrial origin). Indeed these last lines (it is in fact bands of tight lines) are not affected by the displacement due to the Doppler effect of the earthmoving around the Sun or around its axis of rotation. One then uses either the line at 6871.5 angströms of atomic oxygen, or a whole of lines of H2O located in the vicinity of the red line of hydrogen. The correction of the radial velocity of the Earth is described in the following paragraph.
VisualSpec makes it possible to calculate a nonlinear law of dispersion (until power 5). However, although dispersion is not rigorously linear in the spectr'aude, in a routine way one considers a linear law in the vicinity of the red line of hydrogen and one uses for the spectral shift computation the spectral lines of the atmospheric H2O which are numerous in this area of the spectrum and often quite visible in an observatory of plain. The spectral calibration is done by visual examination of the correlation of a synthetic H2O spectrum and H2O lines actually observed (see paragraph 4.8). Average dispersion in this zone of the spectrum is of 0.3802 A/pixel. The spectral calibration if of 0.1 angstroms for bright stars (M<6).
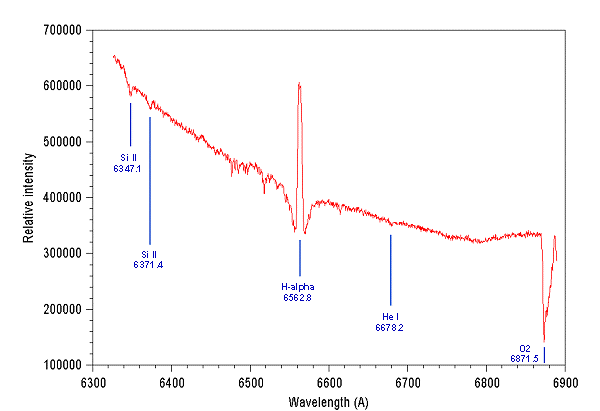
The spectral profile of HD169033 spectrally calibrated is reproduced hereafter with the identification of some lines (one can note the similarity with the Vega star profile):
Click here for other informations about spectral calibration.
4.5. Radial velocity correction
For precise spectral calibration
it is important to understand that the measured radial velocity
of a star represents the relative motion of the star with respect
to the observer at the time of the observation. Because the observer
moves due to the Earth's rotation and revolution around the Sun,
these motions have to be eliminated from the stellar radial velocity.
This reduction step is called the heliocentric correction. For this,
the command RVC of IRIS return the radial velocity of the
observer relative to the observed object and the wavelength correction
needed to correct the observed spectra (Doppler effect for the wavelength
6562.8 angstroms). The max correction for the Earth motion is roughly
30 km/s.
The RVC command return also the Heliocentric Julian
Day. It is the Julian Day adjusted at the center of the Sun and
depends on the standard Julian day of the observation and the celestial
coordinates of the object observed. RVC takes into account
the light travel time for an event coming from a particular location
on the sky to be observed at the center of the Sun. So the Heliocentric
Julian Day remove the periodic paralactic time shift due to where
the Earth was in its orbit when an event was observed. The correction
can amount to as much as as little over 16 minutes for observations
taken 6 months apart.
For example consider this two observations the Be-star 42 And (RA= 01H09.5m - Dec= +47°14') :
Observation 1 : Date 31.083 / 07
/ 2001
Observation 2 : Date 10.809 / 12 / 2001
The observatory location is : Longitude
= -1.50858° (Est of Green.) - Latitude = 43.51728°
The next figure show the two observed spectra in the vicinity of
Ha
line (R=7000 spectrograph on the CN-212 telescope).
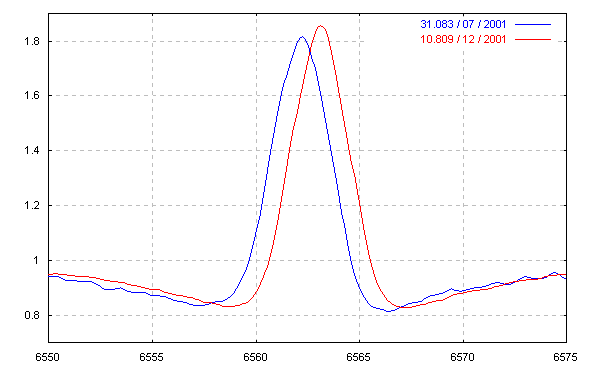
The observed shift is not intrinsic to the stars. The responsible is the Earth movement in space.
Now we compute heliocentric correction. From the IRIS console enter:
RVC 31.083
07 2001 1h09.5m 47d14'
RVC 10.809
12 2001 1h09.5m 47d14'
IRIS return the following informations:
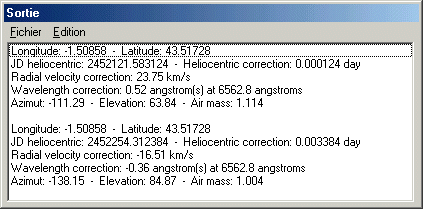
For the observation 1 the wavelength correction (for Ha line) is of 0.52 angstroms (spectral lines shifted towards the blue). For the observation 2 the correction is of -0.36 angstroms (spectral lines shifted towards the red).
The true wavelength l is derived from the observed wavelength l' from the relation (RV = radial velocity in km/sec):

We apply the correction under VisualSpec software (Translate command from the Operations menu). The figure below show the rectified spectra:
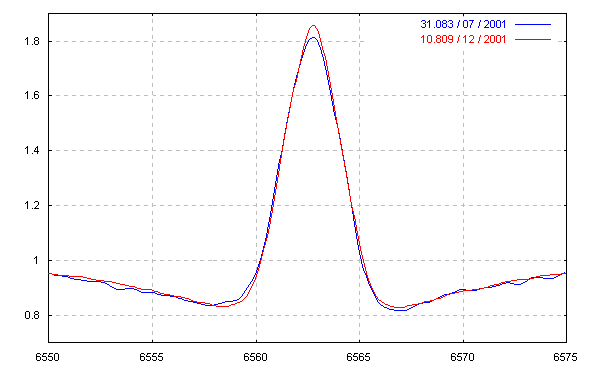
The correction is perfect if we consider the spectral resolution power of 7000 and the original sampling of 0.38 angstroms per pixel. We can now appreciate subtile evolution of the star between this two observations date.
Another example for the star 28 Tau (RA= 3h49.2m - Dec= +24°08') :
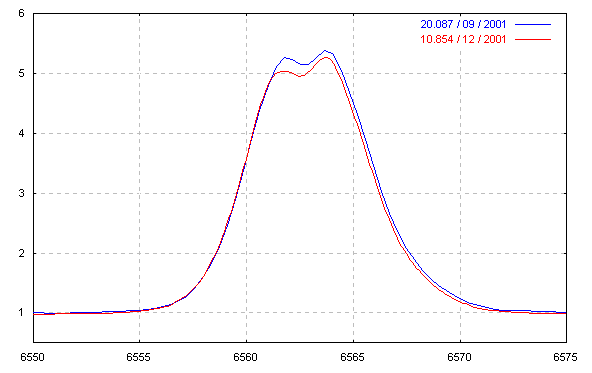
Observation 1 : Date 20.087 / 09
/ 2001
Observation 2 : Date 10.854 / 12 / 2001
Computed radial velocity :
Observation 1 : RV = 26.32 km/sec
(0.58 A @ 6562.8 A)
Observation 2 : RV = -9.59 km/sec (-0.21
A @ 6562.8 A)
Following figure correspond to the observed data (rest wavelength):
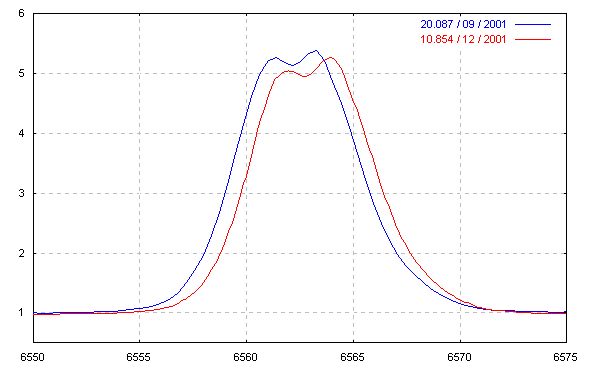
Following figure correspond to the corrected data for the Earth velocity (note small change of the emission line amplitude):
