Use Audine for acquire images
Iris has some commands to acquire
images from the Audine camera. These
functions at the origin were written for the assistance for the
development of this camera. One describes more particularly here
a function written to precisely measure the characteristics of the
occultation of a star by a body of the solar system. The application
applies to the preparation to the occultation of star HD205829 by the
Titania satellite of the Uranus planet on September 8, 2001.
Before acquiring an image you must define the value of some of parameters. Click on the following button of the tools bar:
A dialogue box appears:
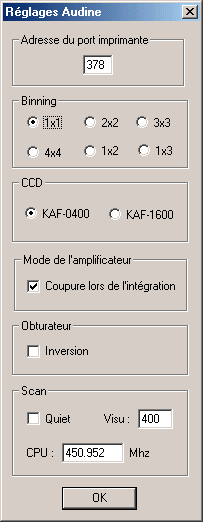
You must imperatively enter the value of the base address of the printer port on which is connected the Audine camera. This address is into hexadecimal form. It is very often the address H378 (888 into decimal).
You can define the factor of binning, the type of CCD equipping Audine and if you wish to cut the amplifier of the CCD during the integration time (recommended to avoid the phenomena of electroluminescence). The shutter of Audine is commandable, but moreover in function of shutter type it is possible to choose an opening on the high level or the bottom level of the control signal (see the documentation of the camera). Lastly, the Scan options will be seen further in this text.
To acquire an image with the parameters
preset above, it is enough to type the following
command
in the console:
ACQ [ exposure time in seconds ]
For example
ACQ 4.6
take a 4.6 seconds exposure.
Command ACQ 0 produce the minimal exposure (quasi instantaneous).
It is possible to stop the integration before its term while click on the following button of the tools bas (note: this button is inactive during the reading of the image):
Once the finished integration the image is displayed with the screen. You can visualize it, treat it and back up it on the disc in a usual way.
The second command of Iris described here is command SCAN. The use first of this command is the imagery in drift-scan mode: the telescope is stopped, the sky move on the surface of the CCD, but at the same time, the detector is read lines after lines with a speed which is synchronous with the diurnal movement. If the lines of the CCD are correctly aligned compared to the celestial equator and if the reading rate is correct, one obtains a not moved image of the sky.
We will show the use of command SCAN in the context of the measurement of the occultation of a star by a planetary satellite (it is completely similar so that one observes when an asteroid passes in front of a star). The phenomenon is generally fast and it is necessary to date the events well. Acquisition image by image, for example with command ACQ is completely inoperative here.
A solution consists in placing the star which will be occulted in the center of the CCD and to make a traditional stellar tracking. The acquisition is made with an open shutter and by moving the lines of the CCD uninterrupted, very regularly and over one period of time which can reach several minutes. The resulting image then shows a trailing star image, a little similar so that one would obtain if one moved the telescope during a long exposure time. The exposure time is here equal to the time of run of a single line of the CCD under star. This time can be very short. The image hereafter shows the beginning of the trace left by star (in fact here a double star, from where the two traces side by side):
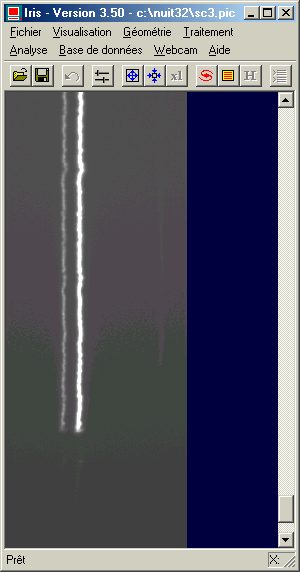
Remember that here the telescope is in sidereal tracking. It is the reading of the CCD, whereas the object always illuminates the CCD surface, which produces the effect of smearing. The result is to some extent being equivalent linearly moving the CCD with the focus plane of the telescope. But here, displacement is electronic (movement of the electric packet charges controlled by the software), which allows very long times of observations if it is wished.
During acquisition, the image builds lines after lines with a frequency controlled by the observer. With the screen the image is built gradually while going from bottom upwards. The operator can see the lines being displayed progressively. The beginning of the image (in bottom) does not show the stellar trail because these first lines of image CCD did not travel under star (this to recall that the star is about the middle of CCD sensor). It is possible to thus acquire a very great number of lines. It is practically the memory of the computer which is the restrictive factor.
In the example above the object observed is star double SAO10937 (HIP207 and HIP208). The object is located at the coordinates:
AD=00h 02m 36.087s
DEC=+66°05 ' 56.28
"
The magnitudes of 15.2 seconds separation components are V=5.9 and V=7.2. This couple simulates well the characteristics of Uranus and the star which will be occulted on September 8, 2001.
The instrument used for the observation is Celestron 8 and the Audine camera, equipped with a KAF-0401E. The camera is placed directly at F/D=10 focus (2 meters focal length).
Here the image of the couple realized in a standard way right before acquisition of the scan (exposure time of 10 seconds):
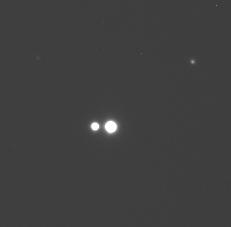
It should be noticed that the camera was directed so that the axis connecting the couple is perpendicular to the direction of the scan (bottom to the top here). This makes it possible to have a maximum spacing of the components of the couple on the trace.
Once the centered star and focusing well you can run the SCAN command. The syntax is:
SCAN [ x1 ] [ x2 ] [ time of integration ] [ nb_ligne ]
The parameters [ x1 ] and [ x2 ] define the horizontal coordinates in pixels of the band effectively numerized during the scan. Indeed, on account of the effectiveness, it is not essential to acquire all the width of the CCD if one is interested only in one star or has a tight couple: one limits the occupation of the memory and it is the guarantee to obtain a very long tape.
The time of integration is the duration in second which is passed between the acquisition of two consecutive lines of the CCD. Here the exposure time is 0.13 second. It is selected by successive step tests and by examining the intensity level of trail (command STAT for example). The detector should not especially be saturated, i.e. with Audine not to exceed the level of 32767 ADU.
Finally [ nb_ligne ] is the number of lines in the final image once the completed scan. In the example one asked for 7000 lines. The time of observation of star is thus of 7000 X 0.13 = 700 seconds (15 minutes and 10 seconds).
For the circumstance, the wide of the scan is of 181 pixels and the final format image is thus of 7000 X 181 pixels, which represents a file of 2.5 Mo approximately on the disc. It is relatively little and it would be possible to work during tens of minutes without problems with a modern PC comprising 128 Mo of memory RAM or more.
For the example the entered command is thus:
SCAN 300 480 0.13 7000

Once that you made < Return >, acquisition begins. In the title bar of the command lines windows you see the number of the line currently acquired, the hour and the Julian day. The image of the scan is displayed too with the screen in real time, but only X last lines obtained not by disturbing the regularity of acquisition because of a possible problem of display (an image scan is likely to be very large). You can define the value of X in setup dialog box of the camera in the scan section dialog (Visu parameter). A value ranging between 300 and 500 lines is typical.
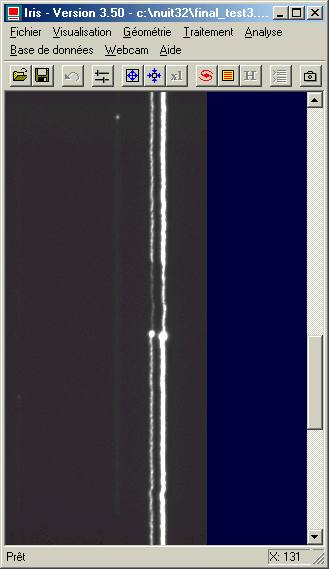
The key of success of the scan rests on the regularity of the run of the lines, the precision in absolute value of the time of integration applied and finally the precise dating of the acquisition of the first line of the image. You can block all the activity of the PC during scan by select Quiet option in the camera setup (but it is not possible to stop the scan until end). In the other side (no check Quiet option), if you move a windows during a scan the effect is disastrous:
To guarantee the absolute value of the integration time and the dating Iris exploits special instruction RDTSC of the Pentium microprocessor for the management of the time. Instruction RDTSC (read timer-stamp counter) was envisaged by INTEL for the measurement of the performances of the computers equipped with the processor of the mark. Today microprocessor of manufacturing competitor have the same instruction, it is the case for example for the series of Athlon of AMD.
Instruction RDTSC permit to read a 64 bits register which is incremented at the frequency of clock of the CPU With 500 Mhz PC it is possible to measure the duration of events with a margin of a few nanoseconds.. Iris uses this meter to determine the moment when it is necessary to read a line of the CCD during scan, like giving the clock system per hour with a precision equal or lower than 0.1 second (indeed, the procedure of reading of the camera via the port printer makes derive the clock system). But so that all this functions it is necessary to specify to the program which it is the frequency of clock of the computer. You can find this information in the notice of your computer, but the value is generally not enough precise (there are significant differences between the oscillators equipping a same series with PC). Command CPU of Iris find with precision this frequency of clock. Syntax is:
CPU [ time ]
The parameter is a time in seconds which will be timed with precision by Iris. For example made:
CPU 120
The computer wait during 2 minutes. The result is the frequency of clock of the PC.
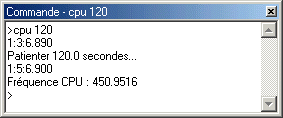
In the example, the CPU frequency is
of 450.952 MHz.
The CPU frequency of your computer in MHz is to be informed in the setup dialog box the Audine camera.
Remenber to reduce the sources of turbulence and also the vibrations to obtain a quite regular trace. In the example below a large house window was open near the telescope during acquisition, from where appearance of a strong turbulence...
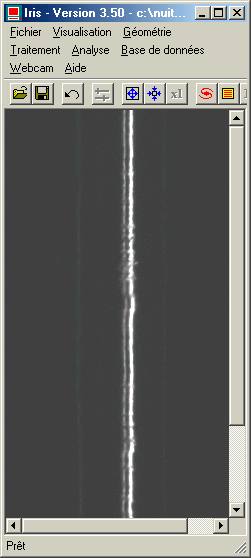
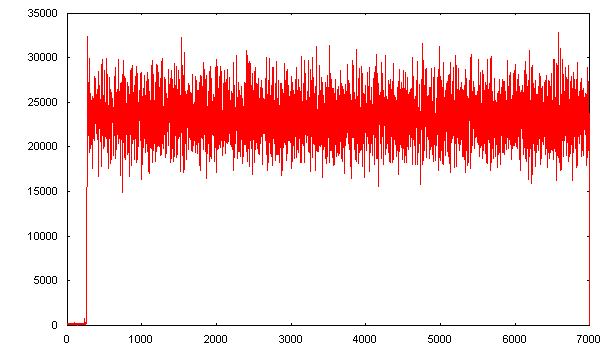
The critical point is the détermination of the exposure time. It should be chosen carefully not to saturate (level of 32767 ADU with the Audine camera) and it is strongly recommended to take a margin to take account of the effect the flicker atmospheric. In the example, the exposure time finally adopted will be 0.1 second, which brings the average level of the most brilliant star towards 23000 ADU.
Note: It is easy to simulate an occulation by blocking the input of the telescope manually, lasting one second for example:
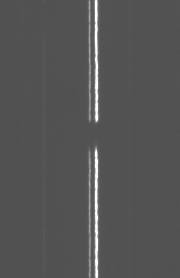
At the end of the acquisition of the scan, Iris displays the image. The image is also saved automatically in the working directory under the name @ by safety measure.
Iris produces also a text file having for name JD.LOG. This file contains an essential data: the moment of acquisition of the lines of the image. Here the beginning of a standard file JD.LOG:
Nb lines: 7000
Programmed
interval (S): 0.1300
X1: 300 - X2: 480
Start
dates: 28/8/2001
Start hour: 1:46:14.100
End
dates: 28/8/2001
End hour: 1:46:18.0
1 2452149.573774306
2 2452149.573775810
3 2452149.573777315
4
2452149.573778819
5 2452149.573780324
6 2452149.573781829
7 2452149.573783333
8 2452149.573784838
9
2452149.573786343
10 2452149.573787848
11 2452149.573789352
12 2452149.573790857
13 2452149.573792361
14
2452149.573793866
One first of all finds the number of lines in the scan. Then exposure time per line (in seconds), dates and hours of acquisition of the first line and the last line. Well on, in addition to the precise estimate of frequency CPU of the computer, so that these last data have a significance it is necessary that the PC either has the hour. A good means is to synchronize it by using Internet (for example starting from the very good program Dimension 4). If a synchronization is made right before acquisition, have can estimate the error on the absolute dating at 0.1 second. The error over the exposure time is largely smaller because of the use command RDTSC.
The continuation of the file is the date of acquisition of each line of the image in Julian day.
Finally Iris generates the textual file DELTA.LOG which gives the error estimated on the dating of each lines.
1 0.0000000000
2 -0.0000067401
3 -0.0000134802
4 -0.0000202203
5 0.0000132728
6 0.0000065327
7 -0.0000002074
8 -0.0000069475
9 -0.0000136876
10 0.0000198054
11 0.0000130653
12 0.0000063252
13 -0.0000004148
14 -0.0000071549
15 -0.0000138950
16 0.0000195980
17 0.0000128579
18 0.0000061178
19 -0.0000006223
20 0.0001078932
A value higher than some tenths of a second in this table is the sign of a problem during acquisition. A too short time of integration can be the cause for it very well. The maximum frequency of acquisition with Audine used over all its width (768 pixels) is about 20 Hertz (time of integration equal or higher than 0.05 second).
Some information now about data processing.
First of all it is necessary that the trace is horizontal then which is vertical with coming out of acquisition. To permute the axes it is necessary to run the command MIRRORXY which does not require any parameter.
The quality of the of the intensity distribution curve of the scan (the signal according to time) is very strongly improved if one practices an operation of binning which consists in bringing back in a point the signal spread out by turbulence over the transverse axis to the trace. A complication is due to the fact that atmospheric agitation moves with an amplitude sometimes significant the gravity center of the instantaneous image of star. This obliges to choose a width of relatively significant window of binning so that it includes essence of stellar flow and for thus not producing a photometric error. However, a broad window has to measure a basic signal of significant sky, i.e. an interfering signal which noisy measurement. It is necessary to try to optimize this operation of binning. Let us see that.
The image below shows a characteristic
portion of scan. To note that there is a coherence
between
the two traces of the object because a short angular distance separates
the
components from double star. In other words, the two
stars are agitated in concert by
turbulence (spatial coherence).
Note also a polar alignement problem.

Command TRAIL determines the center of gravity of trailing stellar image for each acquired line and shifts the lines with a fraction of pixel close so that they have all the same common center.
The syntax of the command is:
TRAIL [ y0 ] [ y1 ] [ y2 ]
The parameters Y1 and Y2 are the approximate vertical co-ordinates of two points which frame the trace all along the trajectory (see the figure above). The parameter Y0 is the coordinates vertical on which will align the trace of the object after processing (Y0 can be a real value). Generally Y0=(Y2+Y1)/2 is made.
In the example we have:
TRAIL 65 25 105
Here the result:

Instantaneously, the slope of all the traces stellar of the image is corrected. Moreover the seeing (turbulence) along the axis perpendicular to the traces is cancelled. The traces are much finer. This is a favorable situation for photometric studies.
Note: command TRAIL automatically generates the TRAIL.DAT file which gives for each point of the trace the correction in Y realized. The analysis of this file is a good tracer of the degree of turbulence and error of tracking of the telescope.
Before calculate the binning which will lead to the photometric profile it is very important to substrat the sky background level. The good command is L_SKY2.
Enter simply command L_SKY2 from console without parameter. Iris awaits you
define 4 points in the image:

Horizontal coordinates (X) of the points pointed
with the mouse do not have importances. Only
the coordinates
Y is used for the computation. The algorithm is the following:
(1) the level of the sky background is computed for each columns by making the median of the intensities ranging between points1 and 2.
(2) the level of the sky background is computed for each columns by making the median of the intensities ranging between points 3 and 4.
(3) For each column the mean of the two background levels found as in step (1) and (2) is calculated and subtracted from the intensity of all the pixels belonging to this column. One proceeds in the same way individually for each columns.
The result is an image whose sky background back to a value close to zero.
The binning itself is carried out with the assistance of command L_ADD. Syntax is:
L_ADD [ y1 ] [ y2 ]
Point the coordinates Y (verticals) of the two points in the image by helping you of the mouse:

These points delimit a area around the trace that include at least 95% of the stellar signal. Typically it is necessary to have Y2-Y1=6 . FWHM, with Y1 and Y2 the vertical coordinates of the two points.
Here we make:
L_ADD 57 73
Note: you could also enter L_ADD 73 57, Iris arrange order of the coordinates for you.
The result is an image of 20 pixels broad which represents the photometric profile after binning along axis X of the image. The 20 pixels belonging to a same column of the binning image have all the same intensity:
![]()
It is possible to display the photometric profile under Iris by typing the following command:
L_PLOT
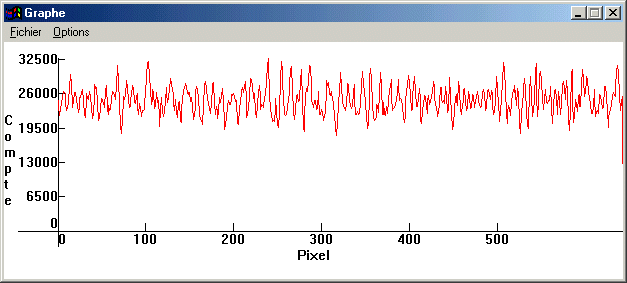
You can at this stage save the photometric profile for a processing with another software by using the Save command under File menu of the Plot window.
The oscillations of large amplitudes are essentially caused by atmospheric scintillation. A telescope 20 cm in diameter is very sensitive to this phenomenon because it has a size close to the Fried diameter (r0). A telescope of bigger size, by integrating the cells of turbulence of the atmosphere in its pupil, is less sensitive to scintillation. The phenomenon of scintillation is here the principal factor of limitation of the measuring accuracy (photometry and chronology), well before the camera for example.
In the particular case of the occultation of Titania, it is possible however to benefit from the strong degree of coherence between the trace of star and the trace of Uranus. By dividing the photometric profile of the first by the second one very appreciably reduces the effect of scintillation. It is possible to see the result directly under Iris by dividing the two binning images with command DIV, then by tracing the resulting photometric profile (this is possible directly only if the objects are aligned exactly perpendicular to the axis of the trail direction, in the contrary case it is necessary to make translate one of the profiles compared to the other to take account of the temporal shift). Below, the profile of secondary star divided by the main star. The noise is appreciably reduced.
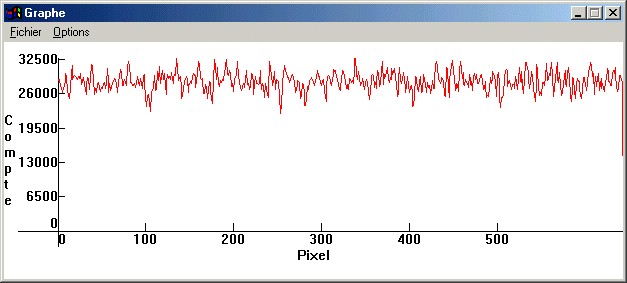
The graph below shows a complete recording over 15 minutes of the signal of principal star of couple SAO10937.
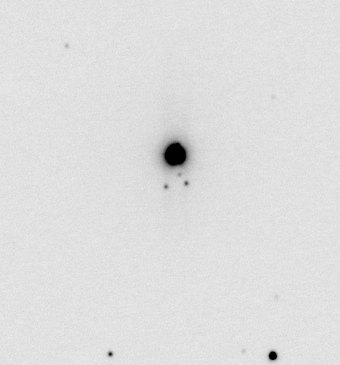
Here the Uranus planet and its procession of satellites observed on August 24, 2001 towards 22H25 UT with Celestron 8 with F/D=10 (composite of 5 images posed 30 seconds).
For more information on the mode drift-scan technique see the page of Alain Klotz devoted to the subject. You can also examine a special page on the drift-scan on the Audine site.
One describes now briefly an alternative of the scan techniques for acquire planetary images at high rates all while not requiring the use of a shutter. It is the video mode reading of the CCD. Click here for more details.
Without shutter and when a brilliant object is observed, here the planet Saturn, here what one obtains:

The smearing phenomenon makes the image completely not exploitable. What it occurs: during the reading of the CCD, which lasts several seconds, planet always illuminates the detector and produces a trace very intense as the electric charges are transferred in column. The technique which enabled us to make fast photometry at the beginning of this page turns over now against us for preventing observation of details of planetary surface.
In the video mode one produces a particular shift of the electric charges which causes to simulate the presence of a shutter. The image is read by groups of 3 bands. The sequence is the following one: (1) fast reading of the electronic image on N lines (information is not even digitized), (2) realization of a waiting time which is the effective exposure time and which little to last only a few milliseconds, (3) fast reading of N following lines, (4) normal reading and storage in the memory of the PC of N following lines, (5) the cycle come back to point 1 once as one wishes it. With each cycle one records in same image CCD a sub-image of the object. Below, an example for Saturn (C8 and not cooled Audine KAF-0400E camera at the F/D=10 focus):


On left, the exposure time is 1 second by sub-images (to note the presence of satellites and the strong saturation of planet). In the center, the exposure time is 0.075 second (the signal covers all the dynamics of the camera, i.e. 15 bits). Right, the exposure time is 0.01 second. In this last image the smearing starts to appear, but is not strictly crippling still. One sees that with an astronomical camera CCD which authorizes a very fine tuning of the chronogram (it is the case of Audine) it is possible to obtain a behavior close to a webcam, with flexibility in more (easy modification of the exposure time for example). One can also underline that there are no parts moving which are likely to produce vibrations or to wear following an intensive use. But attention, the principle of the video mode is only valuable for the observation of specific objects or small sizes (planets). There is no question of obtaining by this method an image of the Moon or Sun. The command in Iris which to acquire this manner calls VIDEO.
The acquired sub-image are cut to produce individual images, which can beings treated then in a traditional way. It is in particular possible to select the best images before add of individual images. There is also the possibility of fine registering of the images before the final composition, which is equivalent to compensate part of atmospheric turbulence (tilt term). These properties (selection, centrering) constitute strong arguments for test this acquisition procedure! Use the command VIDEO_EXTRACT for extract the sub-images.
The syntax of the VIDEO command is:
VIDEO [ x1 ] [ x2 ] [ time of integration ] [ size of a block ] [ number of blocks ]
The parameters [ x1 ] and [ x2 ] define a zone along the horizontal axis which will be used to produce the final image. The more the width is reduced, faster is acquisition.
The time of integration is in seconds.
One gives then the height of an elementary block (value of N in preceding description).
The number of blocks is the number of sub-images desired.
Example:
VIDEO 190 260 0.075 120 130
You can stop acquisition with the red button of the tool bar.
Taking into account the mode of reading, it is necessary to position in a particular way the object studied on surface of the CCD. You must divide the CCD along the vertical axis into bands of N lines and position the image of planet as indicated in the following figure:
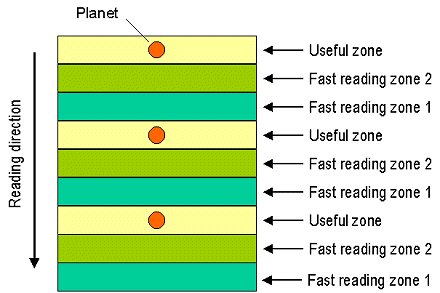
To help you to position the object command VIDEO_GRID traces the zone in the current image. For example:
VIDEO_GRID 120
The syntax of command VIDEO_EXTRACT is:
VIDEO_EXTRACT [ name ] [ height ] [ first index ]
The parameter [ name ] is the generic name
of the extracted images. [ height ] is the width of
the
sub-images. [ first index ] is the index of the first image of the
sequence. Example:
VIDEO_EXTRACT SAT 120 1
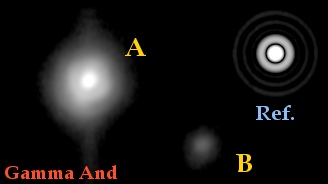
Below, an exemple of diffracted limited
image of the double star Gamma And. Thanks to the video technique!
The airy disk is added by using the command AIRY. For more details,
click here.
