THE LITTROW SPECTROGRAPH
![]() Pour une version en franšais
de ce texte, cliquer ici.
Pour une version en franšais
de ce texte, cliquer ici.
This page reports the status of a Littrow type spectrographs, the first results obtained with different configuration designed and describes a processing procedure for spectra calibration.
Tables of Contents
1. OBJECT
2. TECHNICAL PRINCIPAL CHARACTERISTICS
3. TEST OF THE LOW RESOLUTION
VERSION
3.1. Description
3.2.
Calculation of the throughput
3.3.
First results
3.4. Calculation of the signal-to-noise
ratio
3.5. Calibration
3.6.
Partial conclusion
4. PROCESSING OF A SEQUENCE OF SPECTRA
4.1.
Preprocessing (manual method)
4.2.
Preprocessing (automatic method)
4.3.
Importation of 1-D spectral
image
4.4. Spectral calibration
4.5.
Radial velocity correction
4.6.
Normalization process
4.7.
Radiometric calibration
4.8.
Remove the telluric lines
4.9.
Flux Calibration
4.10. Remove the continuum
5. OBSERVATION OF SURFACE OBJECTS
5.1.
Importance
of the slit in the case of surface objects
5.2. Acquisition and processing
procedures
5.3. Examples
The object of this page is the description of the Littrow type spectrographs. This type is relatively simple to build, which constitutes a good means of demystifying spectrography, then to show all the interest of it. By associating a spectrograph to a CCD camera the amateurs have in hand the possibility of obtaining scientifically exploitable spectral data (see for example the project stars Be on this site). Even with a telescope of 100-mm diameter only it is perfectly possible to usefully study a great number of stars. The force of the amateurs, like very often, comes from their numbers and their capacity to observe objects over a long period of time, which is not always possible in the professional world. Thus a collaboration amateur/professionnel takes all its interest, in spite of the relative smallness of the instruments of amateurs. But, the experiment shows that the valid spectral data acquisition requires more than ever a certain rigor and a good methodology on behalf of the observer, but there is nothing insurmountable !
2. PRINCIPAL TECHNICAL CHARACTERISTICS
Several prototypes of Littrow spectrograph were built (Robert Delmas, Christian Buil, Thierry Maciaszek). The spectral resolution go from 1000 to 10000 following the model. One of these spectrograph is used since 1999 on the programme of monitoring of Be-stars. The most recent model is also more the resolvant (R=10000, click here for details).
The principal parameter to be defined when designing spectrographe is the spectral resolution. This one must be selected according to the type of observations and stars concerned, because there is not universal spectrograph which allows to do everything. For example, which says a high resolution says observations which this confines with relatively brilliant stars to compensate for the strong dilution of the light in a very spread out spectrum.
A low resolution version (R=dl/l= 1000 approximately) gives access to the spectrum of objects of weak glares. The applicability is overcast then the spectrophotometric study of variable stars, the evolution of the novae or certain supernovas, the analysis of the spectrum of the most brilliant planetary satellites , the study of comets...
The high spectral resolution is equivalent to increasing a particular area of the spectrum so for example analyzing the temporal evolution of the profile of a line (case of the survay of the Be stars with the observation of the line H-alpha). It is this type of high resolution spectrograph which makes it possible to obtain results most immediately usable within the framework of a joint program amateurs/professionnels. But the low resolution should not be neglected for as much because it is it only with the telescopes of amateurs who give access objects such as weak active variables, novae, comets...
Practically (and at first approximation), the distinction between a low resolution and high resolution spectrograph is given by the level of the number of grooves per millimeter of the diffractive grating used and by the focal distance of the objective/collimator section. This last parameter determines also the size and the mass of the spectrograph and thus, its capacity of carrying on a type of given telescope. To fix the orders of idea, a prototype version of the low resolution spectrograph includes a photographic objective of 35 mm focal-length (Nikon in F/2) and a grating of 600 lines/mm (origin Edmund Scientific). The version used on the star Be program (magnitude limit of 8 with a 8-inch telescope and R=7000) includes an objective of 180 mm focal distance (Nikon in F/2.8) and a gratings of 1200 grooves/mm. The Littrow spectrograph in R=10000 uses an achromatic doublet lens of 300 mm focal-length and a grating of 1200 traits/mm (limiting magnitude of 6 with a telescope 200 mm in diameter). There is however a higher limit for the value of the focal length, imposed by the dimension of the grating (and its price) and also by the mass. Beyond some weight the spectrograph must be deposited with the foot of the telescope and it is necessary to bring the light through optical fiber.
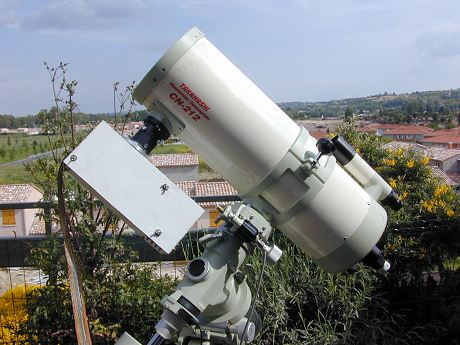
The figure hereafter shows the spectrograph with R=7000 (dispersion of the spectrum of 0,38 A/pixel - assembly out of wooden) in place with the Newton hearth of a telescope CN-212 Takahashi.
The optical configuration adopted for the
spectrograph is of the Littrow type because it optimizes the size and the cost (the
same lens objective is used as collimator and camber objective and
this saves room...). The Littrow mode is characterized by nearly
equal incident and diffractive angle on the grating (click here for more
information about spectrograph setup).
With small telescope
spectrograph can be used with a large input slit (width of a few millimeters).
The traditional function of the slit in a spectrograph is here fulfilled
by the star itself, which is viewed as a point at the focal plane
of the telescope. This configuration, known as slitless spectrograph,
avoids having to very precisely position the image of star at the
center, which saves plenty of time when pointing and makes it possible
to use the spectrograph with moderate stable equatorial mountings.
In addition with a wide slit the photometric efficiency is maximalized
(with a fine slit of a few tens of micron part of incidental flux
is blocked at the entry of the spectrograph, and this is the same
in a case of a spectrograph with optical fibre). In the opposite,
the use of a wide slit requires additional work during the calibration
stage and limit the accuracy of this calibration.( reminder, the
spectral calibration consists in associating a wavelength to a pixel
number).
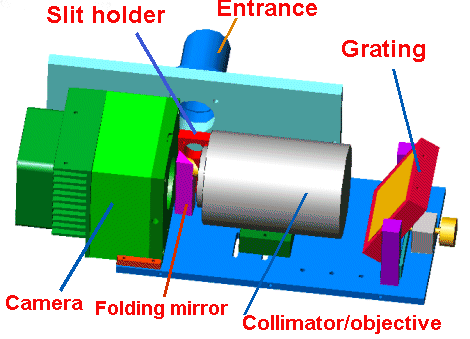
Diagram in 3D showing the various components.
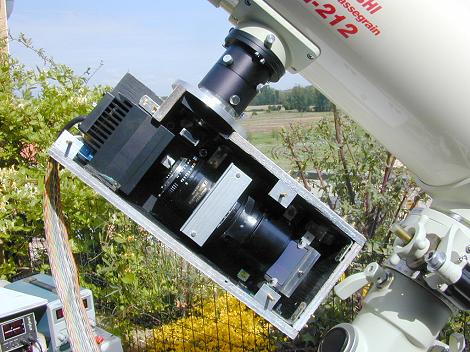
The open box of the high resolution version (R=7000 version) on a Takahashi CN-212 telescope. The photographic objective of the spectrograph is a 180-mm Nikon model. The grating is an Edmond Scientific of 1200 lines/mm.
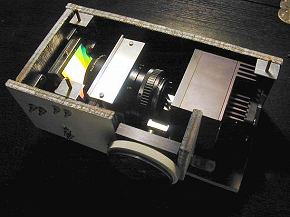
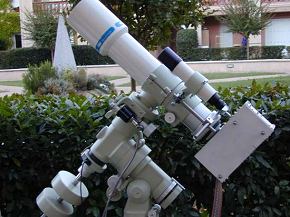
Another prototype
(R=5500 version) on a Takahashi FSQ-106 refractror (notice the presence
of a comparator for precise focusing). The photographic objective
is here a 135-mm focal length Olympus model. Click
here for R=10000
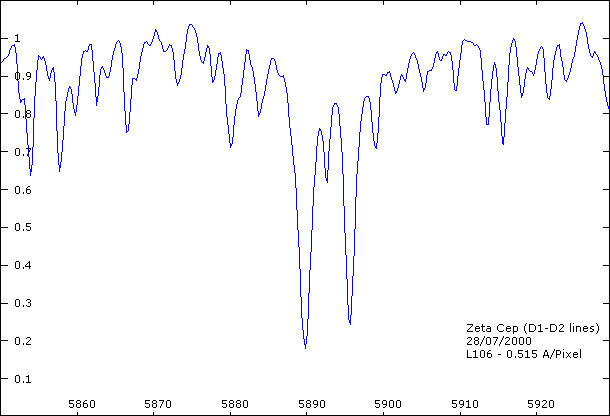
setup.

Resolution test of a moderate resolution version of the Littrow spectrograph (dispersion of 0,515 A/pixel - R=5500) on a small portion of the spectrum of the star Zeta Cepheus (spectral type K1) in the region of the Sodium doublet (D1-D2). The wavelength of these lines is 5889.97 and 5895.94 A. Doubled, drawn aside 6 A approximately, is perfectly separate. Small line is also visible inside, which indicates the good resolving power of the spectrograph.